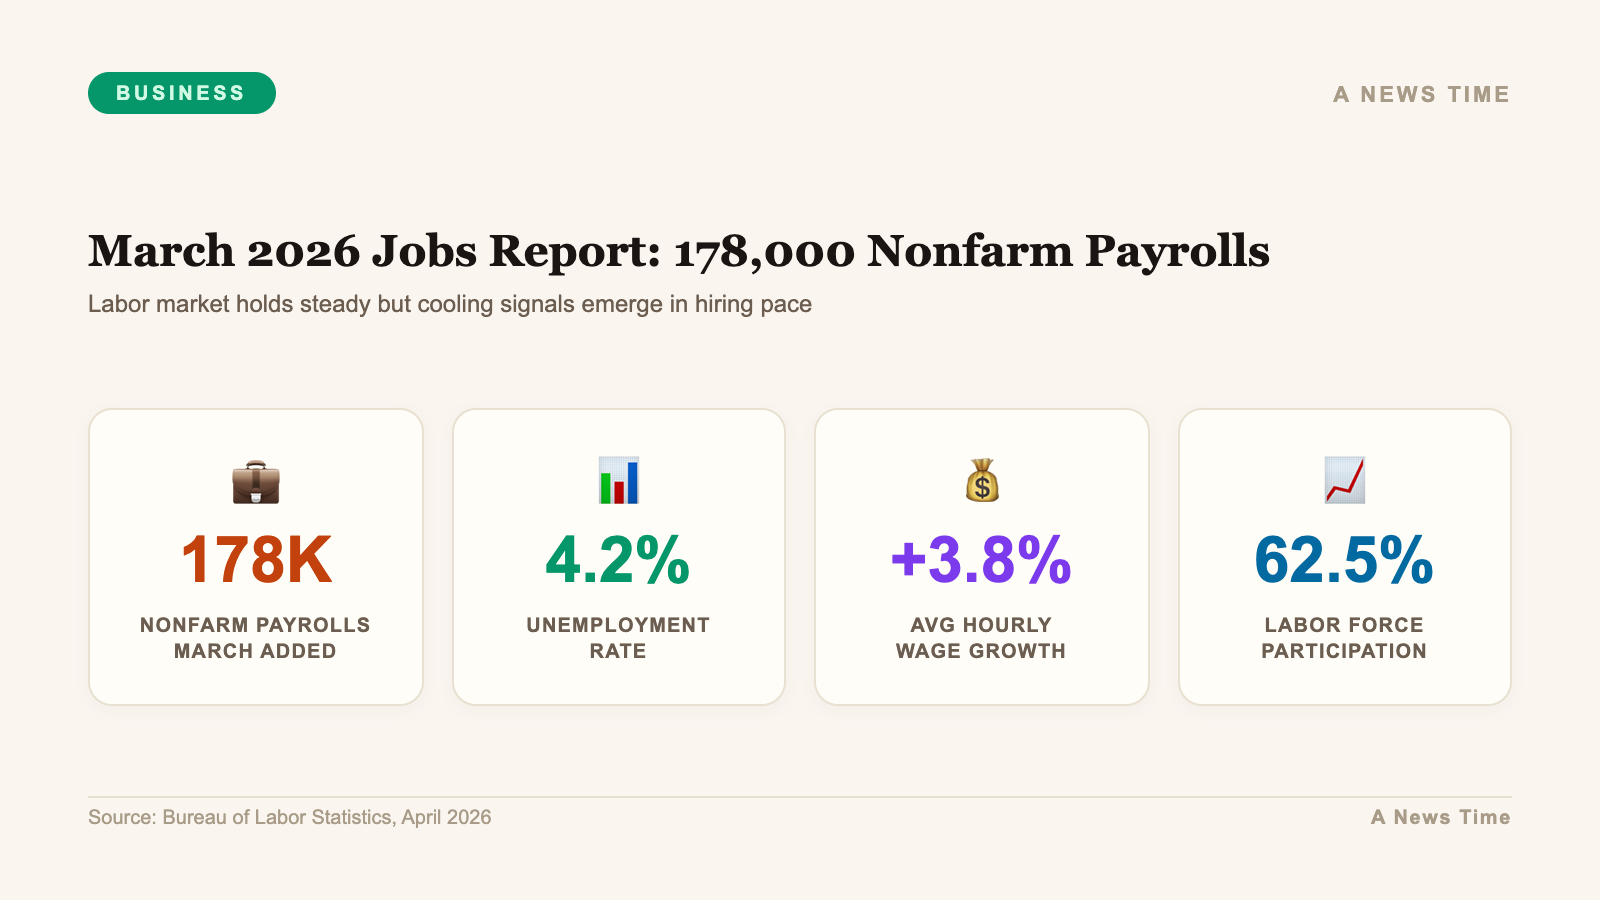
The Bureau of Labor Statistics dropped a number on April 3 that nobody was fully prepared for. Nonfarm payrolls rose 178,000 in March 2026. The consensus forecast among Wall Street economists was 65,000. The gap between expectation and outcome was not a rounding error or a seasonal quirk. It was a labor market that economists had significantly underestimated.
The unemployment rate edged down to 4.3% from 4.4% in February. That is a move in the right direction, but the more important signal is the quality and composition of the March gain, not just its size. A headline number inflated by healthcare sector recovery after a February strike, combined with construction rebounds after winter weather disruptions, tells a different story than broad-based demand-driven hiring across the economy.
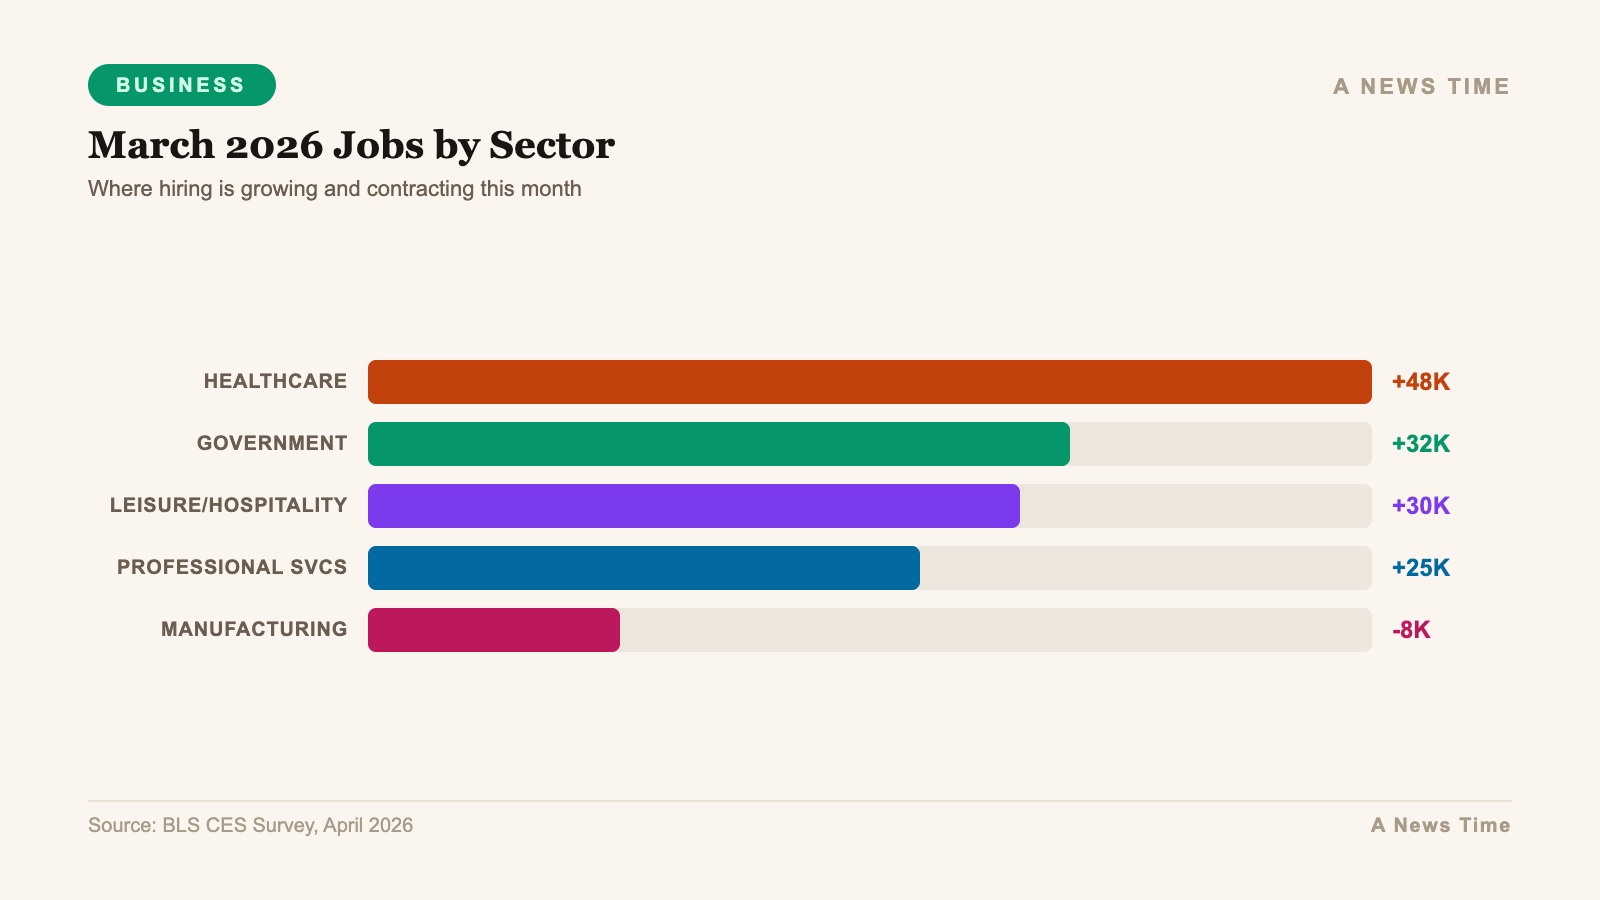
The Sector Breakdown: Where the Jobs Came From
Healthcare dominated the March gains, adding 76,000 positions. That figure almost certainly captures the normalization after February's healthcare worker strike, which contributed to February's revised -133,000 print. Construction added 26,000, consistent with spring seasonal hiring patterns amplified by a mild late-March in most of the country. Transportation and warehousing added 21,000.
The notable drag came from the federal government, which shed 18,000 jobs in March, continuing a trend tied to ongoing Doge-era federal workforce reductions. Government employment at the federal level has been declining steadily since late 2025, providing a persistent modest headwind to headline payroll growth that partly offsets private sector gains.
| Sector | March Change | Context |
|---|---|---|
| Healthcare | +76,000 | Strike normalization + seasonal |
| Construction | +26,000 | Spring seasonal, weather normalization |
| Transportation & Warehousing | +21,000 | Demand-driven, spring inventory build |
| Federal Government | -18,000 | Ongoing federal workforce reduction |
| Technology | -8,000 (est.) | AI-driven restructuring continues |
| Total Nonfarm Payrolls | +178,000 | vs. 65,000 consensus estimate |
The BLS also revised January payrolls upward to 160,000 from the initially reported figure, while revising February down to -133,000. The two-month net revision was 7,000 lower than previously reported. The February revision, reflecting the healthcare strike impact, was already expected and does not materially change the trend narrative.
The Break-Even Rate: Why 178K Is Not as Hot as It Looks
The Dallas Federal Reserve Bank provided a critical frame for interpreting March's outsized gain in a March 31 analysis. Dallas Fed economists showed that the monthly "break-even" rate of job growth, defined as the number of new jobs needed to keep the unemployment rate stable, has fallen dramatically from its peak.
Break-even job growth peaked at approximately 250,000 per month in 2023. By July 2025, it had fallen to roughly 10,000 per month. From August through December 2025, it averaged approximately negative 3,000 per month, driven by net unauthorized immigration outflows reducing labor force growth and shifts in labor force participation. The Dallas Fed analysis concluded that payroll growth from December 2025 through February 2026 "slightly exceeded" that lower break-even pace, consistent with the stable unemployment rate observed during that period.
In that context, a 178,000 print is not a red-hot labor market generating inflation pressure. It is a labor market running modestly above break-even, keeping unemployment stable with a slight downward bias. That is precisely the "soft landing" outcome the Fed has been aiming for, and it does not argue for near-term rate changes in either direction.
Wages: Positive but Cooling
Average hourly earnings rose 3.5% year-over-year in March, down from 3.8% in February. Monthly wage growth came in at 0.2%. With February CPI at 2.4% year-over-year, real wage growth remains positive, providing household purchasing power support that should, in theory, sustain consumer spending through the spring.
Rob Haworth, senior investment strategy director at US Bank Asset Management Group, noted that "the March jobs report shows a labor market that is still growing, but in a more selective way. Investors should pay close attention to the mix of hiring, wages, and labor supply because those details often tell the real story for the economy and markets."
The selectivity point matters. Healthcare hiring is structurally driven by demographics and has limited sensitivity to Fed policy or trade conditions. Construction is partially dependent on housing affordability conditions that remain constrained by elevated mortgage rates. The sectors showing organic, demand-driven hiring growth, professional services, technology product roles, and consumer-facing services, were notably more restrained in March.
"The labor market is no longer running hot, but it is still stable enough to support the expansion. That combination keeps the pressure on the Federal Reserve because slower hiring argues for lower rates, while persistent inflation limits how fast policymakers can move."
Bill Merz, Head of Capital Markets Research, U.S. Bank Asset Management Group
JOLTS, Claims, and the Broader Picture
The March payroll print does not exist in isolation. February JOLTS data, released just before the March jobs report, showed 6.9 million job openings, down from the 8+ million peak of 2022 but still indicating positive demand for labor. The hires rate fell to 3.1%, its lowest since April 2020, confirming that while jobs remain available, employers are exercising caution about when to fill them.
Initial jobless claims for the week ended March 28 fell to 202,000, below the 212,000 economist estimate. Continuing claims rose to 1.84 million. The claims data reinforces the prevailing narrative: companies are not laying off workers aggressively, but they are slowing the pace at which they are adding new ones. That is a soft labor market, not a contracting one.
The March Challenger, Gray and Christmas report added another data point. US employers announced 60,620 job cuts in March, up 25% from February but down 78% from a year ago. First-quarter 2026 layoff announcements totaled 217,362, the lowest first-quarter figure since 2022. Layoffs were concentrated in technology and transportation, with artificial intelligence listed as the leading stated reason for March cuts. That specific callout deserves attention: it suggests AI-driven productivity improvements are generating structural job displacement in white-collar and logistics roles, a trend with multi-year implications for labor market dynamics.
Fed Implications: Hold, But with Eyes Open
The March jobs report gave the Federal Reserve exactly what it did not need: ambiguity. A print of 178,000 versus a 65,000 forecast technically shows a stronger-than-expected labor market, which would argue against rate cuts. But the composition, heavily weighted toward healthcare strike normalization and construction seasonality, removes much of the implied demand-side heat. And the backdrop of elevated CPI from the energy shock gives the Fed cover to stay on hold regardless of labor conditions.
Fed Chair Powell's March 18 remarks remain operative. He cited "low job gains," an unemployment rate of 4.4% (the February reading), and inflation still "somewhat elevated," while the Fed's median projection showed one rate cut by year-end 2026. The March data did not fundamentally alter that posture.
CME FedWatch showed 75% odds of no change at the December 2026 FOMC meeting as of April 3. Tom Hainlin, national investment strategist at US Bank Asset Management Group, said: "This jobs market update should reassure investors that the economy still has support from employment and income growth. It should also remind them that slower hiring and steady inflation can keep markets range-bound until the path for interest rates becomes clearer."
The Middle East energy shock adds a real-time overlay to that assessment. March CPI came in at 3.3%, driven overwhelmingly by the 21.2% spike in gasoline prices from the Iran conflict. Higher energy prices can lift headline inflation, and that makes rate cuts harder to justify even as hiring gradually cools.
What 178,000 Jobs Means for Consumer Spending
Consumer spending is approximately 70% of US GDP. The labor market is the primary mechanism through which household income is generated and spending is sustained. With 178,000 jobs added, wages up 3.5% annually, and claims remaining low, the consumer income picture heading into Q2 2026 is constructive but not robust.
The energy shock provides a significant offsetting headwind. A 21.2% increase in gasoline prices effectively acts as a transfer payment from consumers to energy producers, extracting an estimated $5-7 billion per month from discretionary household spending. That impact will show up in March and April retail sales data, with consumer-facing businesses likely to report softer-than-expected revenue trends in Q1 2026 earnings.
The net assessment: the labor market is providing sufficient income support to prevent a consumer-led recession, but it is not generating the excess demand that would allow businesses to easily absorb tariff and energy cost increases without margin compression. Goldman Sachs raised US recession odds to 30% in March on energy price concerns, a figure that remains the market's best single-point estimate of downside risk.
Participation, Long-Term Unemployment, and the Hidden Slack
Labor force participation held at 61.9% in March, unchanged from February. The employment-population ratio slipped to 59.2%. The number of people working part-time for economic reasons held relatively stable at 4.5 million. Long-term unemployment, defined as 27 weeks or more, remained elevated at 1.8 million, up year-over-year.
That last figure is the one that deserves more analytical attention than it typically receives. Long-term unemployment at 1.8 million represents a pool of workers who have been out of the job market for an extended period and face increasingly diminished re-employment prospects as skills atrophy and network connections fade. It is a leading indicator of structural labor market deterioration that does not show up in the headline unemployment rate.
The combination of steady headline unemployment, elevated long-term unemployment, and falling hires rates paints a picture of a labor market that has stopped deteriorating but has not fully healed. The Fed's policy dilemma is that this nuanced picture does not fit neatly into either a "cut rates" or "hold rates" framework.
March Jobs Report: The Bottom Line
The March 2026 jobs report is best understood as evidence that the US labor market has found a lower-gear equilibrium. Hiring is positive but driven by sector-specific factors rather than broad demand acceleration. Wages are rising at a pace that supports real purchasing power but not at a rate that generates new inflation pressure. Layoffs remain contained. Claims are low. The underlying trend is slowing, not breaking.
For equity investors, the report removes the tail risk of a labor market collapse that would force aggressive Fed easing and risk a demand shock to corporate earnings. It does not provide a catalyst for a significant re-rating of growth stocks or a meaningful shift in the interest rate backdrop. The market implications are, in a word, neutral.
For bond investors, 178,000 payrolls above a 65,000 consensus forecast keeps modest upward pressure on Treasury yields at the short end, reinforcing the "higher for longer" posture. The 10-year yield is likely to remain range-bound between 4.2% and 4.6% until either the inflation picture materially improves or the labor market shows clear signs of deteriorating.
Sources
- U.S. Bank Asset Management Group, Job Market's Effect on the Economy, April 10, 2026
- Bureau of Labor Statistics, Employment Situation Summary — March 2026, April 3, 2026
- Federal Reserve Bank of Dallas, Break-Even Employment Growth Analysis, March 31, 2026
- Challenger, Gray & Christmas, Challenger Report: March Cuts, April 2, 2026