The number that landed on traders' terminals at 8:30 AM Eastern on April 10 was not catastrophic. It was not a replay of 2022. But it was unambiguous, and it was enough to keep the Federal Reserve locked in its seat for another month.
The Bureau of Labor Statistics reported that the Consumer Price Index rose 3.3% for the 12 months ended March 2026, a sharp acceleration from the 2.8% February reading. On a seasonally adjusted monthly basis, CPI jumped 0.9%. Strip out the headline and look at what drove the number, and one factor accounts for virtually the entire story: energy.
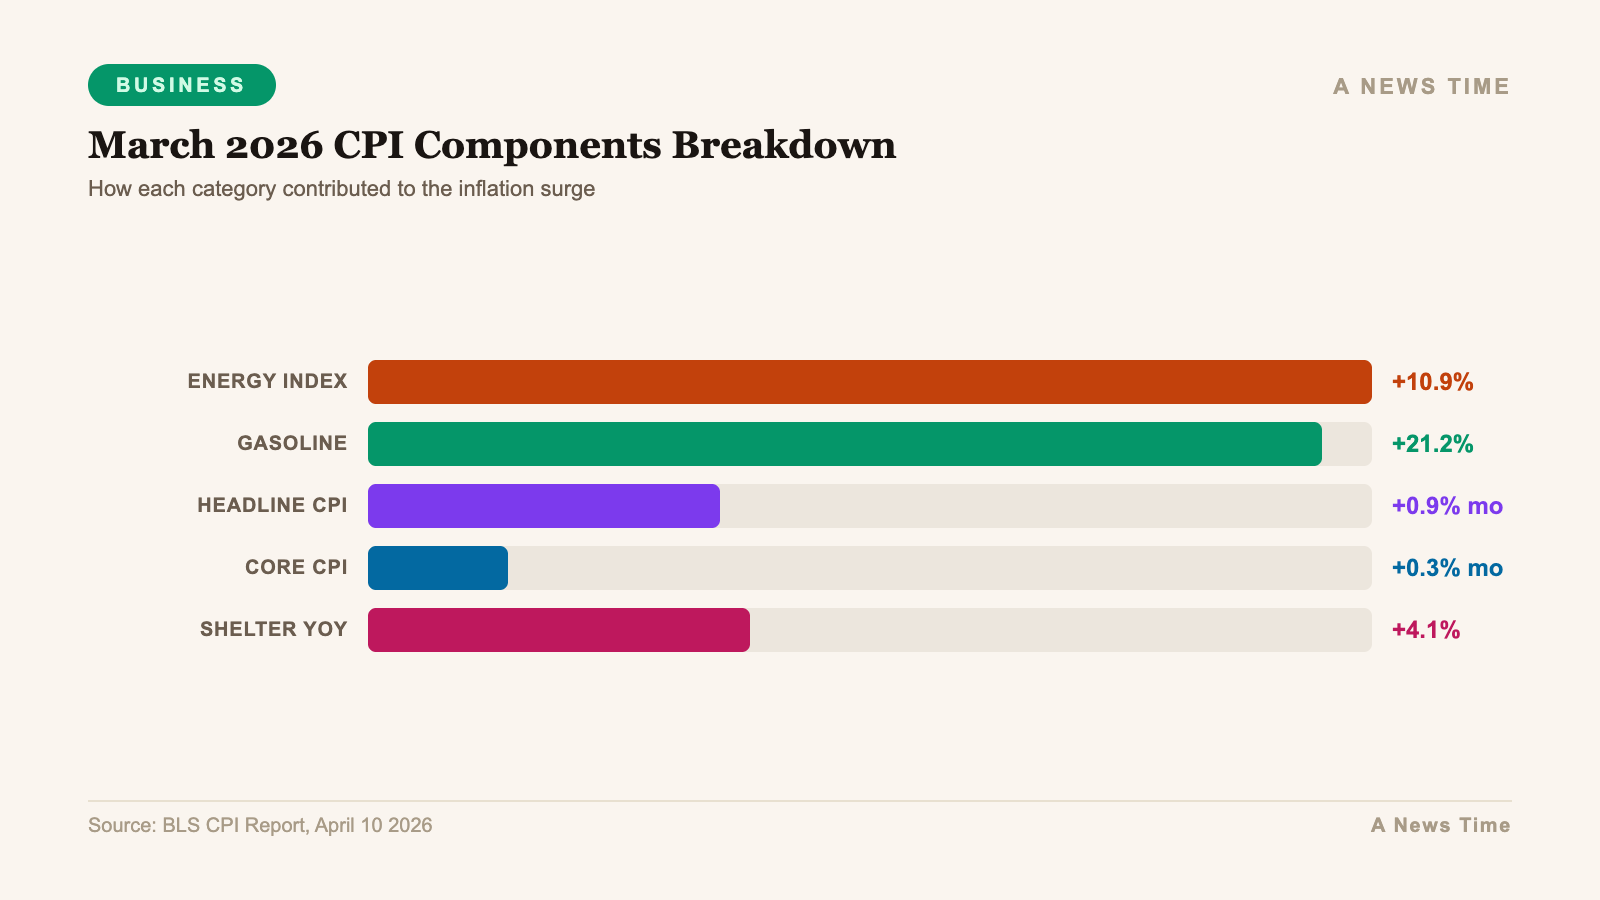
The energy index surged 10.9% in March. The gasoline sub-index alone rose 21.2%, accounting for roughly three-quarters of the total monthly all-items increase. That is not a structural inflation problem. That is a war premium embedded in global oil markets from the five weeks of US-Iran hostilities that preceded the April 8 ceasefire.
The Energy Shock in Numbers
Context matters when reading an inflation print this dramatic. The March data captures the first full calendar month since US and Israeli forces began operations against Iranian infrastructure in early March. Brent crude peaked above $110 per barrel in early April, when Trump issued his 8 PM Eastern deadline to Iran to reopen the Strait of Hormuz. At the time of the BLS data collection window, Brent was trading in the $100-$105 range. By the time the report was released on April 10, a ceasefire had been in place for two days, and Brent had retreated to roughly $95.5 per barrel, with West Texas Intermediate at $97.8.
| Category | Monthly Change | Year-over-Year |
|---|---|---|
| All Items (Headline CPI) | +0.9% | +3.3% |
| Energy | +10.9% | +18.4% (est.) |
| Gasoline | +21.2% | N/A |
| Core CPI (ex-food & energy) | +0.3% | +3.1% |
| Food | +0.2% | +2.9% |
| Shelter | +0.3% | +4.1% |
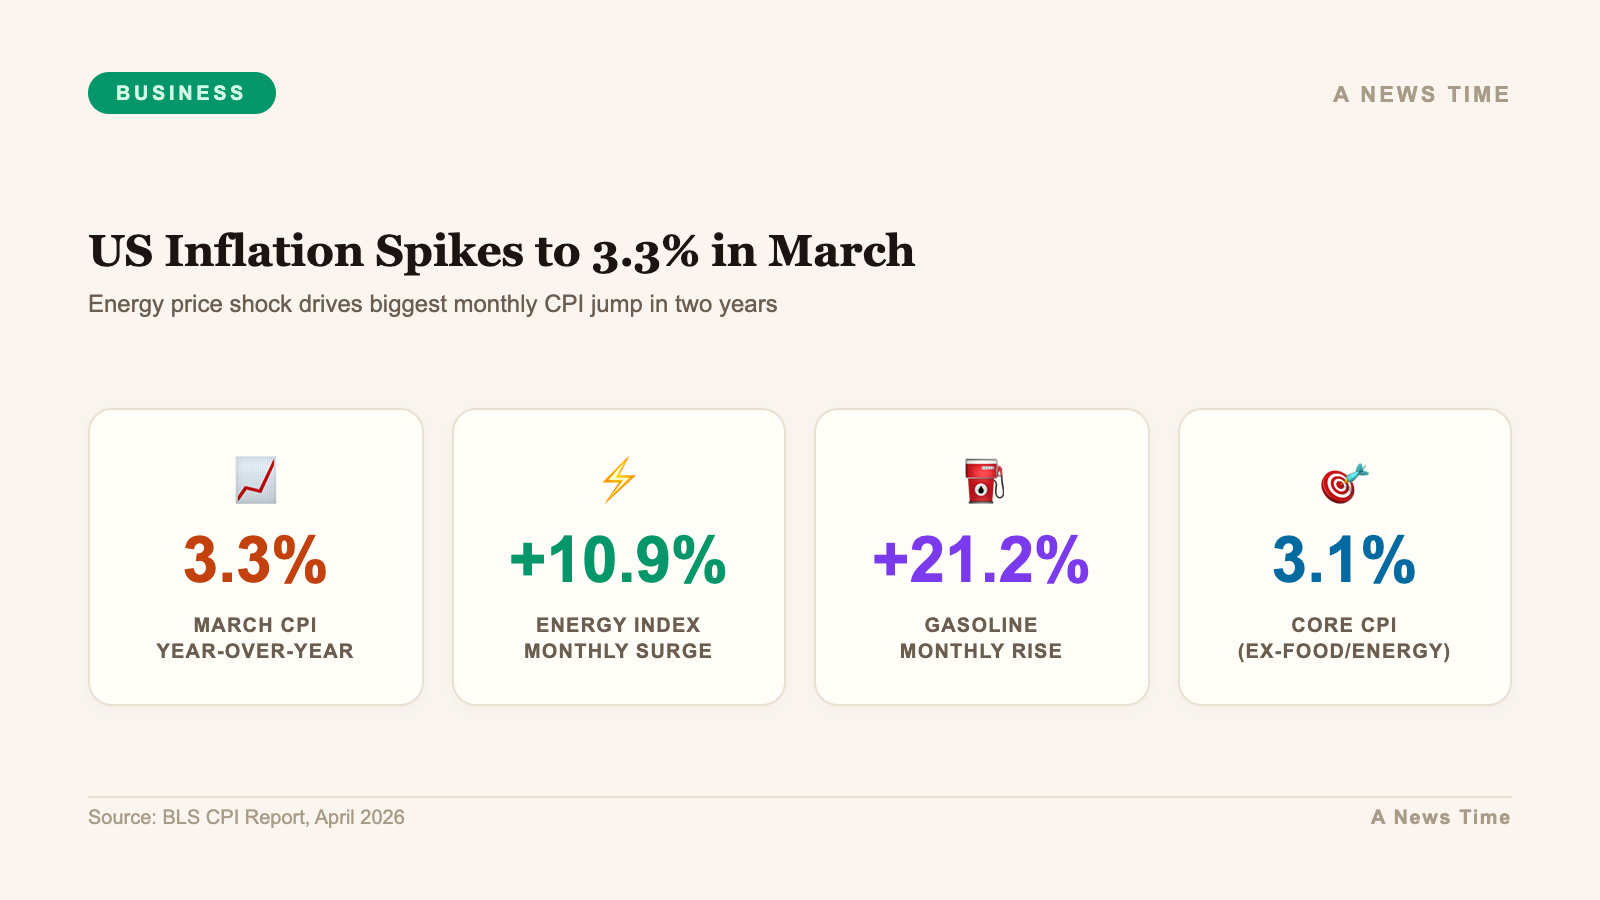
Core inflation, which excludes food and energy, came in at 3.1% year-over-year and 0.3% month-over-month. That figure is concerning but not alarming. Shelter remains the primary driver of core persistence, running at 4.1% annually. Services inflation ex-shelter, sometimes called "supercore" and a favored Fed indicator, edged up slightly but stayed below 3.5%.
The important analytical question is not what March CPI was, but whether the energy component will mechanically reverse as oil prices fall, or whether the shock will prove sticky by transmitting into food transportation costs, airline fares, and broader services pricing. History from the 2022 episode suggests the pass-through to core takes three to six months to materialize.
How Markets Reacted
The reaction was notably muted for a report that showed the largest single-month CPI jump in roughly two years. The S&P 500 was up 0.1% in early trading after the release. The Nasdaq climbed 0.5%. The Dow Jones edged down 0.3%. Treasury yields moved modestly higher, with the 10-year touching 4.41% before retreating.
The market's indifference to the headline number reflects a sophisticated read of the underlying data. Traders know what drove the 3.3% print. They can see oil prices on their screens in real time. With Brent having already fallen from its $110+ peak to the mid-$90s by April 10, the market was already pricing in a meaningful reversal in April CPI.
The more pointed question for asset prices is whether the Fed will use the March print as cover to keep rates on hold through the summer, and whether the inflation narrative could shift again if the ceasefire breaks down and oil re-escalates.
The Federal Reserve's Bind
Richard Carter, head of fixed income research at Quilter, captured the Fed's dilemma precisely in commentary released after the data: "Although Federal Reserve chair Jerome Powell had previously said the central bank would be unlikely to need to raise rates in response given oil price moves, the sheer scale of the price shock this time around meant it cannot dismiss it entirely. Nonetheless, a hold is widely expected at its meeting later this month as it continues to sit in 'wait and see' mode, but all eyes will be on whether there is any indication of a change in its stance."
That "wait and see" posture has been the Fed's operative stance since late 2025. The March jobs report, released April 3, showed nonfarm payrolls rising 178,000, well above the 65,000 consensus estimate, with unemployment dipping to 4.3%. The labor market data gave the Fed no urgency to cut. The March CPI print gives it no urgency to hike. The result is a central bank stranded between two conflicting signals with no obvious path to action.
CME FedWatch data showed markets pricing approximately 75% odds of no change at the December 2026 FOMC meeting as of early April, with just one quarter-point cut priced for the full year. That is essentially the same expectation embedded in the Fed's own March Summary of Economic Projections.
Consumer Impact: The Real Cost of $5 Gas
For households, the abstract number of "3.3%" translates into concrete cash flows. The average American household spends roughly $200-$250 per month on gasoline under normal conditions. A 21.2% increase in gasoline prices adds $42-$53 to that monthly bill. Across 130 million US households, that is $5.5 billion to $6.9 billion per month extracted from discretionary spending and transferred to energy producers.
The distributional impact hits lower-income households hardest. Households in the bottom income quintile spend roughly 8-9% of their after-tax income on energy, compared with 2-3% for top-quintile households. A sharp energy price spike is, in effect, a regressive tax on consumer spending power.
Retail sales data for March, expected in mid-April, will provide the first clear look at whether the gasoline shock crowded out spending on other categories, or whether households absorbed the cost increase without materially cutting back elsewhere.
War Premium: What Brent at $95 Still Means
The ceasefire between the US and Iran, brokered on April 8 and allowing ships safe passage through the Strait of Hormuz, created an immediate relief valve for energy markets. Brent fell roughly 15% from its intraday highs. But at $95.5 per barrel as of April 10, Brent remains substantially elevated versus the $75-$80 range that prevailed before the conflict began.
The war premium in oil markets has multiple components. The most visible is supply disruption: the Strait of Hormuz handles roughly 20% of globally traded oil. Even with the ceasefire, significant infrastructure damage to Gulf energy facilities is expected to keep a portion of that supply offline for months, and in some cases years, while repairs are completed.
Susannah Streeter, chief investment strategist at Wealth Club, noted that "if the ceasefire holds, prices should start to come down a little, but given how fragile the situation is, we are likely to see volatility for weeks, if not months. Significant damage to key energy infrastructure across the Gulf region is set to keep prices elevated until repairs can be completed."
That framing matters for the inflation outlook. If Brent stabilizes in the $88-$95 range rather than falling back to $75, the April CPI release could still show a meaningful deceleration in energy costs, but it would not return to the flat or negative readings that depressed headline inflation through late 2025.
Tariffs: The Second Inflation Layer
Energy is not the only inflationary force at work in the US economy in 2026. The Trump administration's tariff program added a 10% global baseline levy that remains in effect until at least July 24, with threats to raise rates to 15% thereafter. Goldman Sachs economists estimate that the combined effects of tariffs and the energy shock could push US inflation 0.2 percentage points higher by year-end 2026.
The compounding of an energy price shock on top of tariff-driven goods price inflation creates a more challenging picture than either shock alone. Core goods inflation, which had been running negative or near-zero, is now being pushed positive by import tariffs. Core services inflation, primarily driven by shelter and medical care, remains sticky. The energy shock pushes headline above 3%. The result is a Federal Reserve that can credibly argue against both hiking (the underlying economy is slowing) and cutting (headline inflation is above target).
April CPI: The Number That Really Matters
Analysts broadly agree that March CPI is informative but that April CPI, due in mid-May, is the more important release. If oil prices remain in the $90-$95 range through April, the gasoline index will post a significant monthly decline compared to the March spike, pulling headline CPI materially lower. That mechanical reversal does not mean inflation is solved. It means the war premium is partially unwinding.
The specific risk scenario to watch is a ceasefire breakdown. Dan Coatsworth, head of markets at AJ Bell, noted that "this is a pause in the proceedings and not a full resolution. Any market rebound could quickly lose momentum unless there is clear progress with US and Iran talks." If hostilities resume and oil returns to $110+, April CPI could print above 3.5%, forcing a more serious Fed policy reassessment.
The base case, embedded in both market pricing and Fed guidance, is that the March 3.3% print represents a temporary energy-driven spike rather than a renewed inflation cycle. With Q4 GDP revised down to 0.5% and the labor market gradually cooling, the fundamental demand-pull inflation dynamics are not in place to sustain a new inflationary cycle. The Fed knows this. Markets know this. The question is whether geopolitics allows that base case to play out.
What Investors Should Watch
Three data points will determine whether March 2026 is remembered as a temporary war-driven anomaly or the beginning of a more persistent inflation problem. First, the trajectory of Brent crude over the next 60 days. Second, the April CPI print and whether core goods inflation shows evidence of tariff pass-through accumulating. Third, consumer confidence and retail spending data for March and April, which will reveal whether the gasoline shock materially dented household willingness to spend.
For fixed income investors, the March CPI number was not a reason to sell duration aggressively. The 10-year Treasury yield has held relatively stable in the 4.3-4.5% range, reflecting a market that expects the energy shock to fade rather than entrench. Breakeven inflation rates on 5-year TIPS moved up modestly after the data but remain below the levels that would signal a genuine long-term inflation repricing.
For equity investors, the sector rotation implications are clear. Energy stocks have benefited from elevated oil prices; the question is whether that trade has run its course at $95 Brent. Consumer discretionary names with high gasoline price sensitivity will face headwinds in Q1 2026 results. Banks and financials have generally performed well in a higher-for-longer rate environment, but that trade depends on the Fed holding firm, which itself depends on inflation staying elevated.
"All eyes will be on whether there is any indication of a change in its stance or if it will continue to bide its time."
Richard Carter, Head of Fixed Income Research, Quilter
The Underlying Story Has Not Changed
Strip away the war premium and March 2026 CPI tells a familiar story: an economy running at modest growth, with shelter inflation gradually decelerating but still elevated, services prices sticky, goods prices mixed, and energy volatile. The Fed rate outlook remains constrained by the combination of energy-driven headline pressure and gradually cooling underlying demand. That is not a recipe for rate hikes, nor for rate cuts. It is a recipe for the extended pause that markets have been pricing since late 2025.
The March CPI print is a data point in that story, not a chapter break. What happens in Tehran over the next 30 days will matter more for the June and July FOMC meetings than anything in the Bureau of Labor Statistics database.