A year after Liberation Day triggered a 20% S&P 500 selloff over seven weeks, US equity markets in April 2026 have learned to live with tariff volatility without succumbing to it. The market's ability to post its best week since November, driven by Iran ceasefire optimism, while simultaneously digesting a 10% global baseline tariff regime and elevated inflation, tells a story about investor adaptation that is as analytically important as any single data point.
The tariff landscape in 2026 is complex, legally contested, and economically consequential. Understanding it requires separating the headline numbers from the actual transmission mechanisms through which trade policy affects corporate earnings, consumer prices, and investment returns.
The 2026 Tariff Architecture: What's Actually in Place
The Trump administration's tariff program in 2026 operates through multiple legal authorities, several of which are being challenged in court. The Supreme Court's February 2026 ruling that emergency powers could not be used to enact the broader IEEPA-based tariffs forced the administration to rely on Section 122 of the Trade Act of 1974 for its global baseline levy. The US Court of International Trade heard arguments on April 10 about whether that authority is legally sufficient.
| Tariff Type | Rate | Status / Expiry |
|---|---|---|
| Global Baseline (Section 122) | 10% | In effect through July 24, 2026 |
| Potential Post-July Rate | 15% | Threatened; requires new authority |
| China-Specific Tariffs | 30%+ | Ongoing; under negotiation |
| Canada / Mexico (USMCA-Adjacent) | 15-25% | Ongoing; supply chain disruption |
| Automotive (Section 232) | 25% | In effect; under legal challenge |
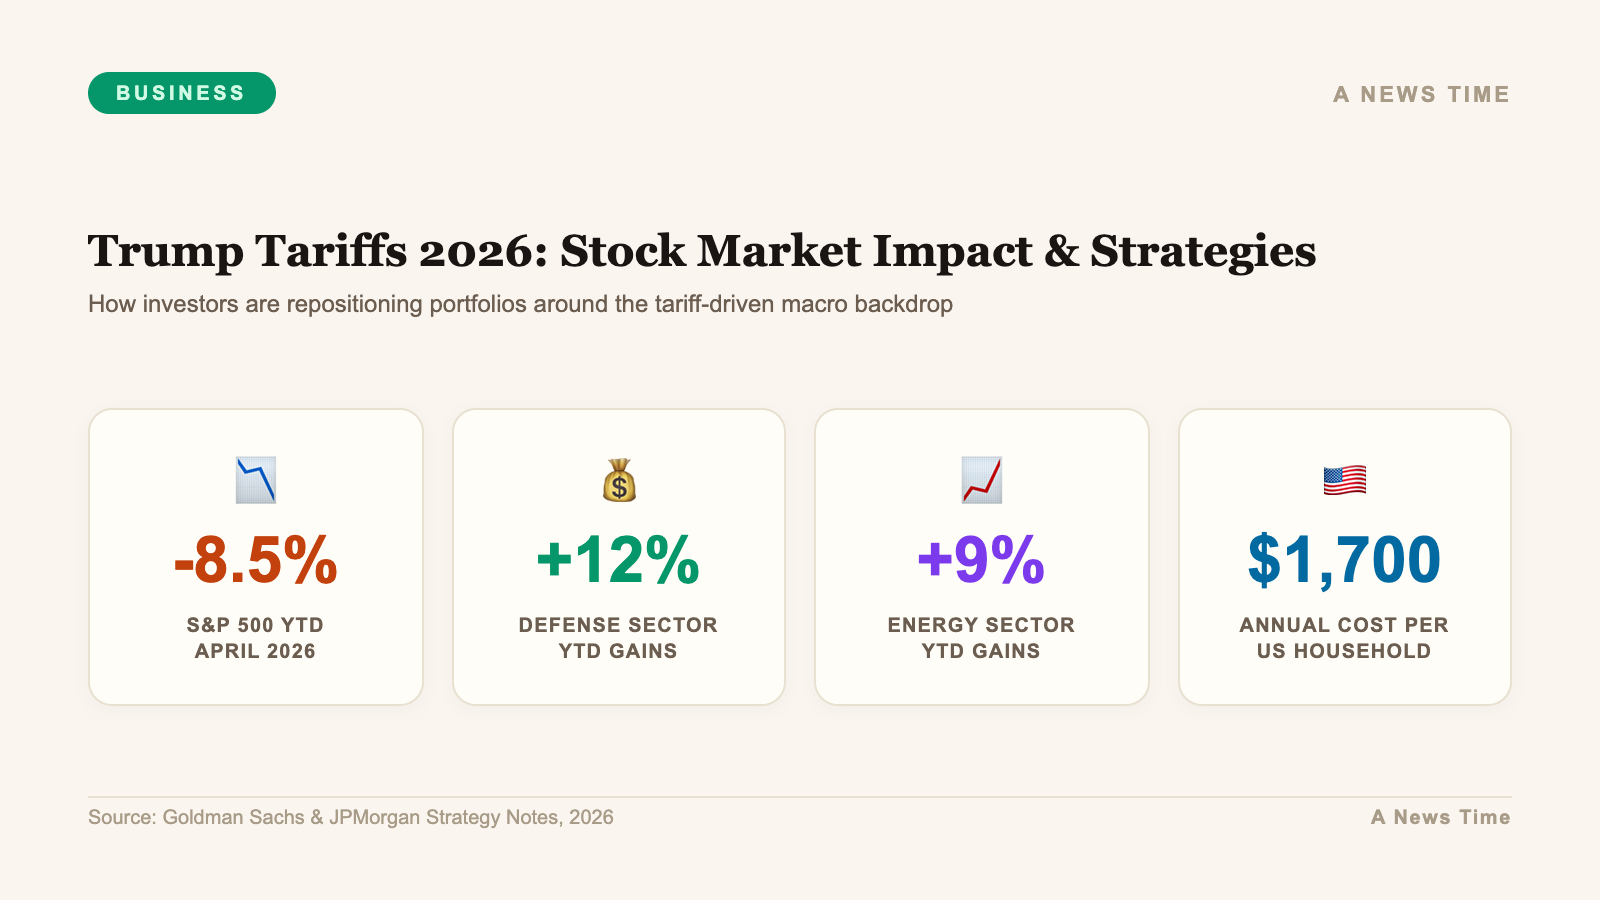
The current policy includes a global baseline tariff of 10% set to remain in effect for 150 days until July 24, with explicit threats to increase rates to 15% thereafter. Additionally, sector-specific tariffs targeting China, Canada, and Mexico continue to create supply chain disruptions across multiple industries. The administration's stated goal of using tariffs as a multi-trillion dollar revenue raiser, while simultaneously threatening to distribute $450 billion to consumers, highlights the internal contradictions that make consistent policy analysis difficult.
One year after Liberation Day, independent economists estimate that 94% of tariff costs have been borne by US consumers and businesses rather than foreign exporters. The effective tariff rate has jumped from 2.4% to 12-13.6%, the largest sustained increase in US trade barriers since the Smoot-Hawley era. The one-year anniversary assessment suggests the initial market shock has been absorbed but the cumulative economic damage is still being tallied.
The Technology Sector: Margin Compression in Slow Motion
Technology represents approximately 29% of the S&P 500's weighting. That concentration means what happens to tech earnings matters for the index in a way that no other sector does. The tariff exposure in technology is both direct and indirect.
Direct exposure: hardware manufacturers, semiconductor companies, and consumer electronics producers source critical components from China, Taiwan, and Southeast Asian nations that face elevated tariffs. Apple's iPhone supply chain, spanning Foxconn facilities in China and Taiwan, faces 30%+ tariff exposure on components imported to US-bound products, even as manufacturing diversification to India and Vietnam progresses.
Indirect exposure: growth-oriented technology stocks are particularly sensitive to interest rate levels because their valuations depend on discounting long-duration future earnings. When the Federal Reserve maintains elevated rates to combat tariff-driven inflation, the discount rate rises and the present value of future earnings falls disproportionately for high-multiple growth names. That dynamic contributed to relative technology sector underperformance in early 2026.
The Q1 2026 earnings season, beginning in mid-April, will provide the first clear corporate data point on actual tariff cost pass-through versus absorption. Companies with pricing power, Apple, Microsoft, and enterprise software names, are likely to show resilient margins. Hardware manufacturers and consumer electronics companies with thinner margins face more challenging arithmetic.
Automotive: The Clearest Supply Chain Story
No sector illustrates the direct, measurable impact of tariffs more clearly than automotive. March auto sales dropped as consumers pulled forward purchases ahead of anticipated price increases from the 25% automotive tariff. The first-quarter 2026 seasonally adjusted annual rate came in at 15.7 million units, a 5.2% decline year-over-year.
The margin mathematics are straightforward. A vehicle with $5,000 in imported components faces a $1,250 tariff cost increase at a 25% rate. On a $35,000 consumer vehicle, that is a 3.6% cost increase that manufacturers must either absorb, pass to dealers, or pass to consumers. Most analysts estimate a roughly 50-50 split between margin absorption and consumer price increases, meaning both vehicle prices and auto company margins are being pressured simultaneously.
Wells Fargo downgraded Ford to Underweight in late March with a $10-$11 price target. JPMorgan maintains an Overweight rating with a $15 target but has flagged tariff-related margin risk as the primary downside scenario. The divergence in analyst views reflects genuine uncertainty about how quickly US automakers can diversify their supply chains away from tariff-exposed sources.
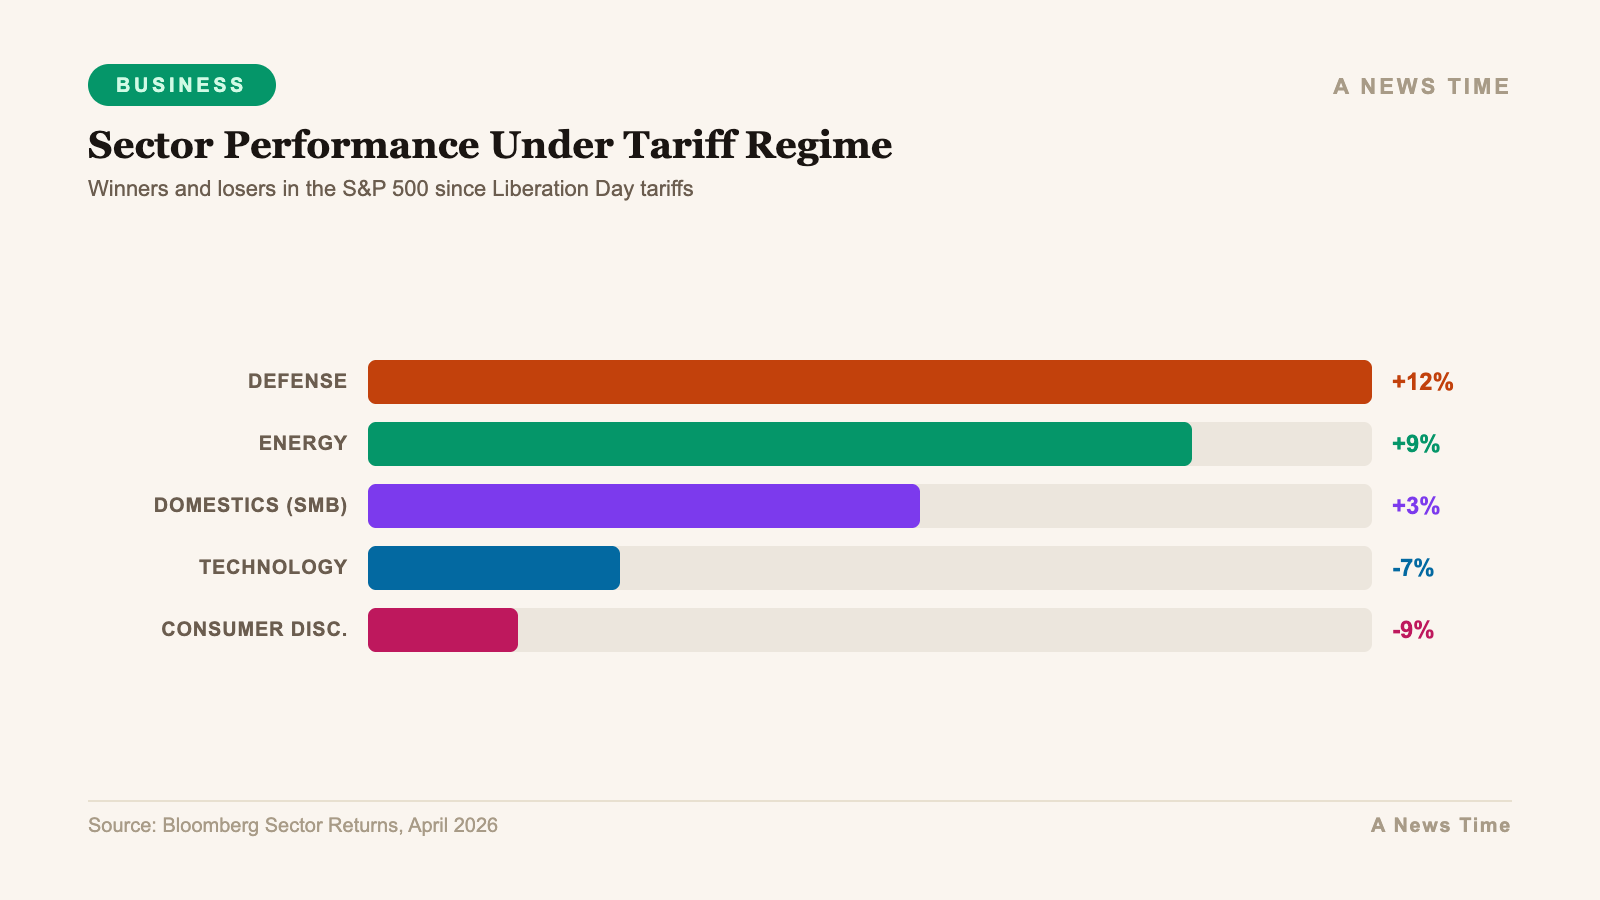
Winners: Domestic Revenue, Utilities, and Dividend Quality
While much analysis focuses on tariff losers, the investment case for tariff beneficiaries is equally important. Three categories are outperforming in the current environment with clear, analyzable reasons.
Domestic-revenue companies face minimal direct tariff exposure because their cost inputs and revenue sources are primarily US-based. Small-cap equities, which typically have lower international exposure than large-cap counterparts, have shown relative strength as tariff concerns have mounted. The Russell 2000 has outperformed the S&P 500 on a risk-adjusted basis in Q1 2026, partially reflecting the domestic-revenue tilt of small-cap indices.
Utilities represent the clearest defensive sector play in a tariff environment. Revenue streams are regulated and predictable. Demand is inelastic. Tariff exposure is minimal because utility inputs are primarily domestic energy, labor, and domestic capital equipment. The sector also benefits from the AI data center buildout, which is driving electricity demand growth well above historical averages across major US metro areas.
Dividend aristocrats, companies with at least 25 consecutive years of dividend growth, offer a specific quality filter in uncertain markets. Jefferies analysts have identified defensive companies with market caps above $10 billion, dividend yields above 3%, and projected earnings growth of 0-10% annually through 2027 as particularly attractive. Procter and Gamble, Johnson and Johnson, and similar names fit that profile: strong competitive moats, pricing power to absorb cost increases, and management teams with demonstrated commitment to shareholder returns through cycles.
How the S&P 500 Processes Tariff Volatility
The S&P 500's performance in April 2026 illustrates a market that has developed a sophisticated mechanism for processing tariff headline risk. The pattern is now well-established: tariff announcement or escalation triggers a 2-5% sell-off, de-escalation or delay triggers a proportional rally, and the net trend remains range-bound as fundamental earnings support competes with tariff headwind uncertainty.
The index posted its best week since November 2025 following the April 8 Iran ceasefire, gaining more than 3% from its intraday lows as oil fell 15% and Treasury yields retreated from their war-premium levels. That rapid recovery from tariff-adjacent geopolitical stress reflects a market that has learned to distinguish between genuine structural threats to corporate earnings and temporary sentiment-driven selloffs.
Goldman Sachs estimates the combined effects of tariffs and geopolitical developments could spike US inflation by 0.2 percentage points to 3.1% by year-end 2026. That inflation transmission, working through higher input costs and reduced purchasing power, represents the primary channel through which tariff policy affects equity valuations. It is not catastrophic on its own, but layered on top of the energy shock from the Iran conflict, it creates a challenging margin environment for companies without meaningful pricing power.
The Legal Uncertainty Premium
One of the least-analyzed dimensions of the tariff impact is the legal uncertainty premium embedded in investment decisions. Capital allocation decisions, particularly the multi-year supply chain restructuring decisions that determine where factories are built, require policy certainty that the current legal environment cannot provide.
The Supreme Court's February 2026 ruling striking down IEEPA-based tariffs, followed immediately by the administration's pivot to Section 122 authority, did not resolve legal uncertainty. It merely changed its form. The April 10 Court of International Trade hearing on the Section 122 tariffs adds another layer of unpredictability to an already unstable policy landscape.
That uncertainty has a measurable cost. Capital expenditure decisions that would have been straightforward at stable tariff rates become contingent bets on legal outcomes. Companies investing in US manufacturing capacity are implicitly betting that tariffs will remain in place long enough to make the investment economics work. Companies maintaining existing offshore supply chains are betting that legal challenges will reduce tariff rates. Both bets carry significant binary outcome risk.
Supply Chain Diversification: Where the Long-Term Value Is
Regardless of how the legal battles over tariff authority resolve, the structural shift in global supply chains that tariff policy has accelerated is unlikely to fully reverse. Mexico, Vietnam, India, and Eastern European nations have attracted significant manufacturing investment as companies seek alternative production bases. That geographic diversification creates investable themes with multi-year horizons.
Mexico benefits most directly from near-shoring trends driven by USMCA trade preferences. Vietnam has positioned itself as the primary China alternative for consumer electronics assembly. India's government has offered production-linked incentives that attracted Apple and several major semiconductor manufacturers. Eastern European nations, particularly Poland and the Czech Republic, benefit from European supply chain reorganization.
Logistics providers, industrial real estate in manufacturing hub locations, and workforce development companies in emerging manufacturing zones represent specific investment opportunities within the supply chain diversification theme. These are real economy plays that benefit from tariff-driven structural change regardless of the policy trajectory at the margin.
Risk Management in a Tariff-Volatile Market
The honest investment advice for navigating the 2026 tariff environment is less about picking winners and losers and more about portfolio construction principles. Diversification across sectors with varying tariff sensitivity reduces concentration risk. Quality factors, strong competitive moats, pricing power, low leverage, and management execution track records, provide downside protection when tariff headlines create volatility.
Maintaining adequate cash reserves, specifically 5-10% of portfolio value in liquid instruments, creates optionality to buy quality assets during tariff-driven selloffs. The pattern of 2-5% drawdowns followed by recovery, which has characterized the S&P 500 in 2026, has repeatedly created entry opportunities for patient capital.
The specific risk to avoid is making large directional bets on tariff policy outcomes, whether anticipating rapid de-escalation or permanent escalation. The legal uncertainty, the political dynamics of trade negotiations, and the geopolitical overlay of the Iran conflict make tariff policy trajectory genuinely unpredictable. Sizing positions to survive adverse outcomes while capturing upside from favorable developments is the appropriate framework.
"The key to navigating this environment lies in understanding exposure, maintaining flexibility, and focusing on quality factors that drive long-term investment success."
Intellectia.AI Research, April 2026
The Outlook Through July: Specific Catalysts to Watch
The current 10% global tariff baseline expires on July 24, 2026. That date is the most important near-term policy marker for equity markets. Three outcomes are possible: the rate stays at 10%, rises to 15% as threatened, or falls due to trade negotiations or legal challenges. Each outcome has materially different equity market implications.
The investor confidence erosion reflected in surveys showing 50% of German companies cutting US investment plans and foreign direct investment staying below projections suggests the international capital allocation consequences of US tariff policy are already materializing. Reversing that confidence damage will require sustained policy certainty, not just a single negotiated agreement.
For domestic equity investors, the period between now and July 24 is characterized by known uncertainty. Markets have priced in a range of tariff scenarios. The energy shock from the Iran conflict is mechanically reversing as oil retreats from its peak. The labor market is cooling but not breaking. The Fed is on hold. In that environment, the appropriate equity market posture is selective quality, defensive positioning in volatile macro, and patience for the specific catalysts that will break the current range-bound structure.