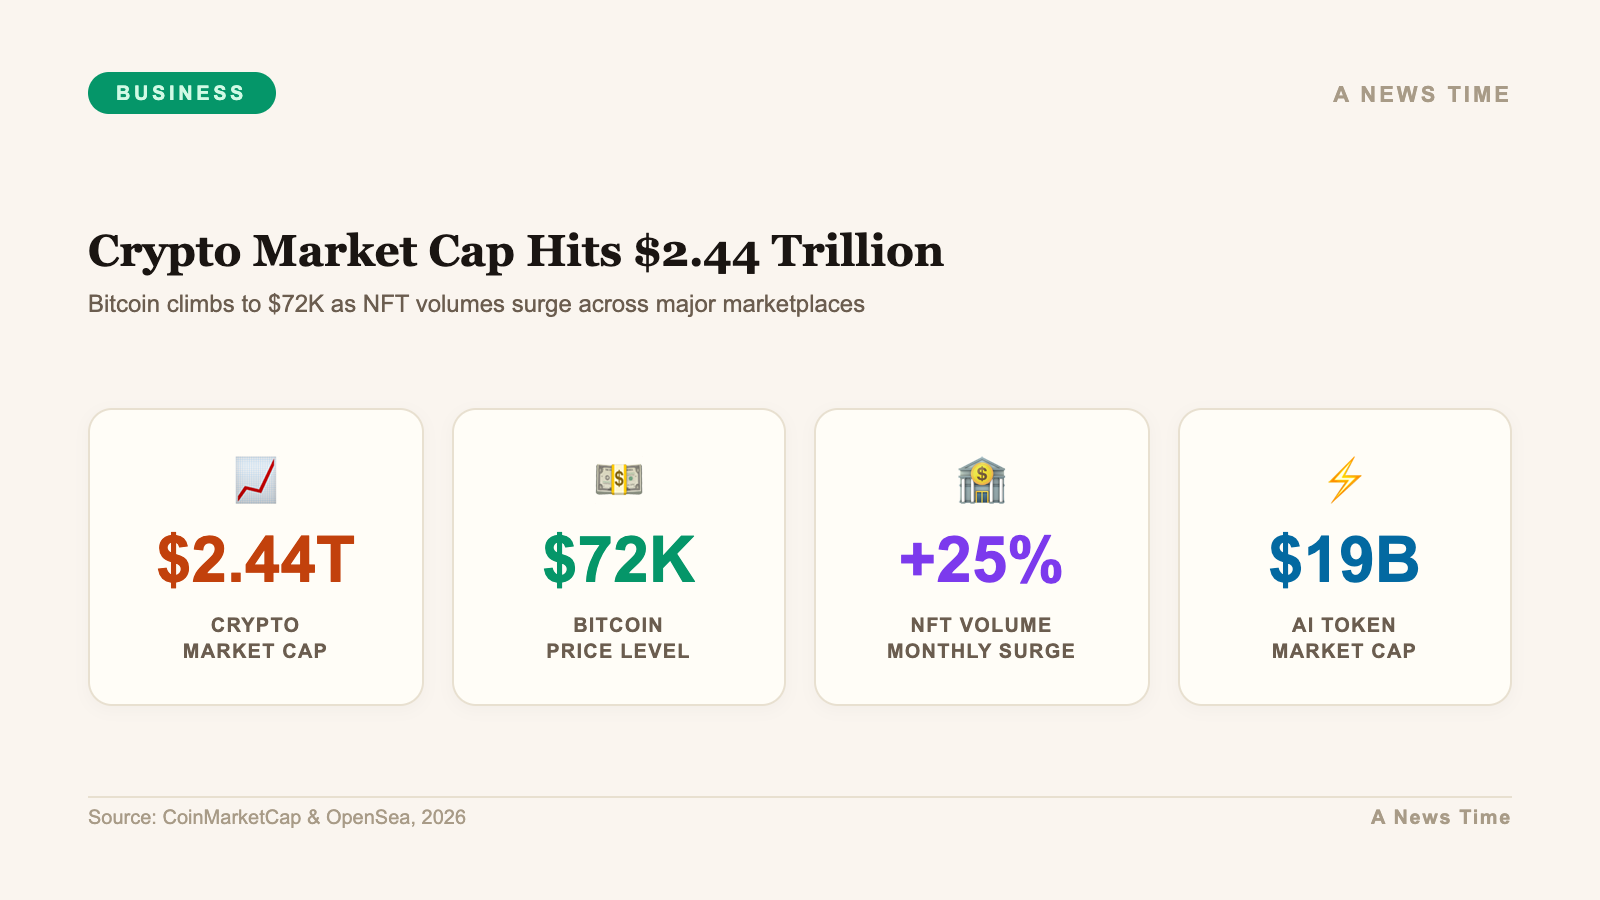
The global crypto market capitalization crossed $2.44 trillion on April 13, 2026, gaining 1.35% in a 24-hour period that showed steady, broad-based appreciation rather than the volatile spike-and-crash patterns that defined earlier market cycles. Twenty-four-hour trading volume came in at $95.31 billion, up 0.82%. The Crypto Fear and Greed Index registered 46 points, sitting squarely in the "Neutral" zone.
That neutrality is analytically significant. Markets at $2.44 trillion in total cap are not in fear-driven capitulation, nor in the euphoric greed that precedes unsustainable parabolic moves. They are in a zone of deliberate accumulation and selective positioning, where informed capital is building positions while retail sentiment remains ambivalent.
Bitcoin at $72K: Dominance Above 59%
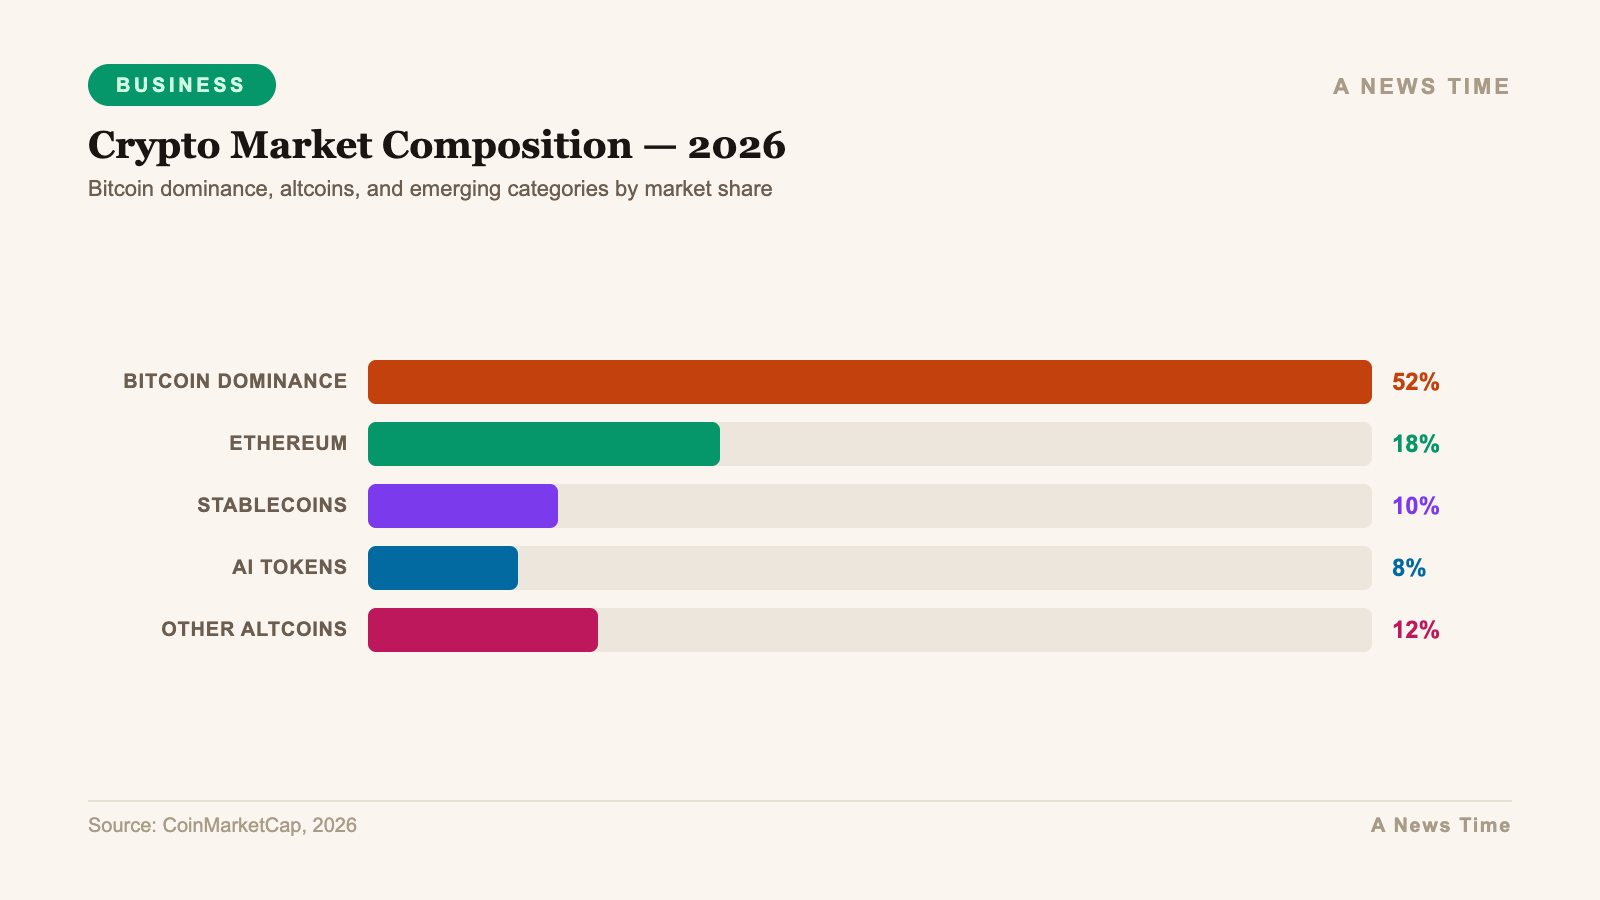
Bitcoin was trading at $72,738 as of the April 13 snapshot, a 0.95% gain. Market dominance held at 59.1%, near its highest reading in over two years. That dominance figure is the most important single metric in the current market structure.
When Bitcoin dominance is elevated and rising, it signals that capital is concentrating in the perceived safe harbor of crypto markets before rotating outward to altcoins. The historical pattern shows Bitcoin dominance peaking at 60-65% ahead of the institutional "altcoin season" that follows once investors are comfortable with BTC's stability at higher price levels. At 59.1%, the market is approaching but has not yet reached that peak.
| Asset | Price | 24h Change | Market Dominance |
|---|---|---|---|
| Bitcoin (BTC) | $72,738 | +0.95% | 59.1% |
| Ethereum (ETH) | $2,234 | +1.82% | 10.9% |
| Total Market Cap | $2.44T | +1.35% | N/A |
| 24h Volume | $95.31B | +0.82% | N/A |
| Fear & Greed Index | 46 pts | Neutral | N/A |
Bitcoin's performance since the US-Iran conflict began in early March 2026 illustrates the asset's evolving role in macro portfolios. While equities and oil markets experienced extreme volatility, BTC initially sold off alongside risk assets before recovering to the $70K+ range. That behavior is consistent with its dual identity as a risk asset in institutional portfolios and a macro hedge against currency debasement and geopolitical disruption.
The ceasefire brokered on April 8 and subsequent relief rally in equities brought Bitcoin along for the ride. At $72,738, BTC remains below its all-time high of roughly $108,000 set in early 2026, but the trend from the March lows has been constructive.
Ethereum's 1.82% Gain: Reading the Signal
Ethereum's 1.82% daily gain, bringing it to $2,234, outpaced Bitcoin's 0.95% on the day. ETH market dominance held at 10.9%, stable relative to the prior week. The outperformance reflects several constructive narratives converging on the Ethereum ecosystem in April.
The SEC's approval of the first staked Ether ETF in late March continues to generate institutional interest in ETH as a yield-bearing asset. Staking yields of approximately 3-4% annually make ETH competitive with money market instruments on a risk-adjusted basis for investors who are already comfortable with crypto exposure. That institutional reframing of ETH as a yield instrument is arguably the most significant structural development in the Ethereum market in 2026.
Layer-2 network activity has also been a quiet but persistent tailwind. Ethereum's Layer-2 ecosystems, primarily Base, Arbitrum, and Optimism, now handle transaction volumes that exceed the Ethereum mainnet itself by a factor of three to four. That scaling achievement is what allows Ethereum to compete with Solana on transaction speed and cost while maintaining mainnet security guarantees.
Today's Top Gainers: Microcap Speculation Still Active
While the large-cap picture was orderly, the daily gainers list tells a different story about one corner of the market. Gold Pump Meme ($GPM) surged 2,794% to $0.011. Base AI ($BASE) gained 303%. ApexToken ($APX) was up 178%.
These are not investable signals. They are evidence that speculative capital, particularly retail participants chasing narrative-driven micro-cap tokens, remains active in the market. The persistence of extreme daily gainers in the micro-cap segment is a feature of crypto markets in all cycle phases, not a specific indicator of market health or direction.
What matters analytically is that these speculative micro-cap moves are not dragging down large-cap performance, and that BTC and ETH are posting gains independent of and unrelated to speculative altcoin activity. That separation of large-cap from micro-cap performance is a sign of maturing market structure.
DeFi TVL: $95.45 Billion, Down 0.49%
DeFi total value locked declined 0.49% on the day, settling at $95.45 billion. The top protocol by TVL, Aave, dropped 0.82% to $25.43 billion. Aave now holds approximately 27% of total DeFi TVL, up from 7% in January 2024, representing one of the most remarkable platform concentration trends in DeFi history.
The DeFi TVL drop deserves context. At $95 billion, total DeFi TVL is near its multi-year highs, substantially above the sub-$40 billion level it occupied during the 2022-2023 bear market. A 0.49% daily decline is noise within a broader uptrend. The structural story in DeFi is consolidation toward well-audited, battle-tested protocols with strong liquidity and clear governance, and Aave's dominance trajectory is the clearest expression of that consolidation.
OKX Wallet's addition of native Aave access on X Layer, announced during the week, represents the type of integration that drives sustained TVL growth. Making institutional-grade DeFi lending accessible through major custodial wallet interfaces reduces the friction that has historically kept institutional capital out of DeFi. The protocol-level metrics, yield rates, liquidation ratios, total borrowing capacity, remain healthy.
NFT Sales Surge 1.81%: Courtyard Leads
NFT sales volume climbed 1.81% on April 13, reaching $6.73 million in 24-hour transaction volume. The leading collection, Courtyard, jumped 6.26%, generating $1.32 million in sales.
Courtyard represents an interesting segment within NFTs: physical asset-backed digital tokens. The platform tokenizes trading cards, luxury goods, and collectibles, with physical custody of the underlying asset. That model bridges traditional collectible markets with blockchain-based ownership and liquidity, addressing the pure speculation criticism of earlier NFT generations.
The broader NFT market context is instructive. Weekly NFT market cap held around $1.05 billion with subdued overall activity heading into April 13, but the daily surge in sales volume suggests periodic demand spikes driven by specific collection activity rather than sustained volume recovery. NFT market structure in 2026 is bifurcated between high-quality, utility-backed collections with institutional and collector interest, and the long tail of speculative profile picture projects that have seen volumes collapse from 2022 peaks.
Regulatory Catalysts Driving the April Narrative
Treasury Secretary Scott Bessent's public push for rapid Congressional approval of the CLARITY Act was the week's most consequential non-price development. The bill would establish the first comprehensive US federal regulatory framework for digital assets, defining which tokens are securities versus commodities and establishing custody and reporting requirements.
The practical significance for institutional capital is straightforward. Compliance departments at major financial institutions have been waiting for regulatory clarity before approving meaningful crypto allocations. A signed CLARITY Act removes that primary compliance obstacle, potentially unlocking hundreds of billions in institutional capital that has been sitting on the sidelines.
Worldcoin's announcement that token unlocks would be reduced by 43% starting July 24 is a different type of regulatory-adjacent development. Token unlock schedules, which govern when team members, early investors, and protocol treasuries can sell their holdings, are a supply-side dynamic that affects price directly. A 43% reduction in scheduled unlocks removes a significant potential seller overhang from the Worldcoin supply picture.
Macro Overlay: The Energy Shock and Rate Policy
The crypto market's April 13 performance cannot be fully analyzed without acknowledging the macro backdrop. March CPI printed at 3.3%, driven by the energy shock from the US-Iran conflict. That number complicates the Fed's rate-cutting calculus and keeps the "higher for longer" interest rate narrative alive.
Higher rates are generally a headwind for risk assets including crypto, because they raise the opportunity cost of holding non-yielding assets and increase the discount rate applied to future earnings or network value. Bitcoin's resilience at $72K despite elevated rates reflects either institutional demand that overrides rate sensitivity, or a market that has already priced in the "higher for longer" scenario and is looking through it to eventual rate normalization.
The ceasefire between the US and Iran, while fragile, removed the tail risk of sustained $110+ oil prices that would have forced a more hawkish Fed response. With Brent settling in the $90-$98 range after the ceasefire, the energy shock is likely to mechanically reverse in April CPI data, reducing headline inflation pressure and potentially clearing the path for a rate cut later in 2026.
What $2.44 Trillion Means for the Broader Cycle
Market capitalization is the most basic but often the most misread metric in crypto analysis. $2.44 trillion in total market cap represents a market that has substantially recovered from the sub-$1 trillion lows of 2022, but remains well below the $3 trillion+ peaks of late 2024. The recovery trajectory is constructive, but the distance from prior highs is a reminder that significant market appreciation is required to reach new territory.
The more important metric is the pace and composition of capital flows. Institutional capital entering through regulated ETF products, corporate treasury allocations, and bank custody services is structurally different from retail speculative capital. It is less likely to exit suddenly on negative sentiment and more likely to maintain positions through short-term volatility. The proportion of institutional to retail capital in the market is higher in April 2026 than at any previous point in the market's history.
XRP's technical base formation and the broader institutional accumulation picture in Bitcoin and Ethereum are consistent with a market that is building the foundation for its next sustained upward phase. The specific timing of that phase depends on regulatory catalysts, macro conditions, and the resolution of geopolitical risk, all of which remain in flux through Q2 2026.
"Scott Bessent, the Treasury Secretary under President Donald Trump, has persuaded Congress to approve the Clarity Act rapidly amid the broader mainstream adoption of crypto assets."
BlockchainReporter, April 12, 2026
The Trader's Checklist for Q2 2026
For crypto market participants, the April 13 data snapshot suggests a specific set of things to watch through the end of Q2 2026. Bitcoin's ability to hold above $70K during macro uncertainty is the primary confidence indicator. The CLARITY Act signing timeline and regulatory follow-through is the primary institutional catalyst. DeFi TVL trend direction tells the story of organic on-chain demand. And the NFT market's recovery or continued consolidation will signal when retail sentiment is ready to re-engage with speculative assets.
The macro backdrop of 3.3% inflation, a resilient but slowing labor market, and geopolitical risk from a fragile ceasefire creates a trading environment where selective positioning and risk management matter more than directional conviction. The market at $2.44 trillion is in transition, between the uncertainty of the first half of 2026 and what the institutional infrastructure being built right now will enable in the second half.