

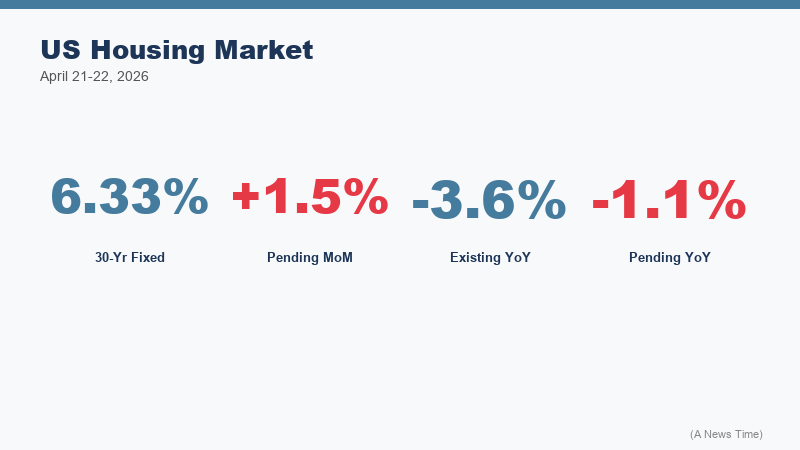
The National Association of Realtors delivered its March 2026 data double-header on , and the numbers require careful parsing. Pending home sales, which measure signed contracts on existing homes and serve as a leading indicator of closed transactions four to six weeks out, rose 1.5 percent from February to March. That gain is real and, in isolation, sounds like forward momentum. The existing-home sales data, which captures completed closings, tells the countervailing story: actual sales in March fell 3.6 percent, declining in every region tracked by NAR. The disconnect between pending activity ticking up and closed transactions falling is not contradictory. It reflects the lag between signing and closing, and more importantly, the number of signed contracts that are falling through or being renegotiated as buyers confront the combination of elevated rates and seller price expectations that have not fully adjusted.
The mortgage rate picture that frames both data points is provided by the Wall Street Journal's April 21 tracking: the 30-year fixed rate stands at 6.33 percent, unchanged from the prior session and at the lowest level in several weeks. That reading is materially below the 7-plus percent that characterized the market in late 2023, but it remains well above the sub-3 percent environment in which millions of current homeowners locked in their mortgages between 2020 and 2022. The lock-in effect, the reluctance of existing homeowners to sell a house financed at 2.75 percent and buy another at 6.33 percent, is the dominant structural force in the housing market and has been for more than two years.
What the NAR Data Actually Shows
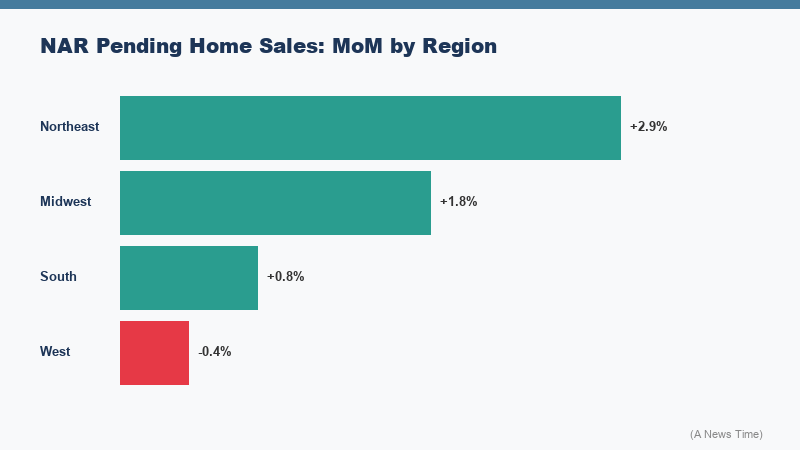
NAR Chief Economist Lawrence Yun attributed the March pending home sales increase to "continued pent-up housing demand" that is slowly forcing some buyers into the market despite challenging affordability conditions. The regional breakdown provides more texture: gains occurred in the Northeast and the South, while the Midwest and West declined. That regional pattern is consistent with prior months and reflects the relative affordability differences between Sun Belt markets, where population growth has continued to support demand even at elevated rates, and the Midwest and West, where inventory costs relative to local incomes create a more acute affordability barrier.
The existing-home sales decline of 3.6 percent in March is harder to interpret optimistically. Year-over-year, total sales remain below the pace that characterized the pre-pandemic market, and the inventory picture is only slowly improving. The months-of-supply figure, which divides current inventory by the prevailing sales pace, has been creeping toward 3.5 to 4 months nationally, still below the 6-month threshold that economists generally identify with a balanced market but better than the sub-2-month extremes of 2022.
"Pending contracts climbed slightly, despite higher mortgage rates and continued pent-up housing demand. Month-over-month gains occurred in the Northeast and South, but declined in the Midwest and West."
National Association of Realtors, April 21, 2026 Pending Home Sales Report
The months-of-supply figure matters enormously for price dynamics. With supply still below equilibrium, home prices nationally have refused to decline meaningfully even as sales volumes have fallen. The NAR's median existing-home price, which was last reported in the mid-$400,000 range nationally, has held up because sellers who do list their homes face a pool of buyers who are rationed more by financing costs than by a lack of desire to buy. This creates a market where price discovery is distorted: the marginal transaction is cash or jumbo-financed, skewing median prices higher than the conforming-loan buyer can actually afford.
Mortgage Rates at 6.33%: What Changed and What Hasn't
The Wall Street Journal headlined its April 21 mortgage rate report with "30-Year Rates Maintain Lowest Point in Weeks," which is accurate but requires context. The decline from the peak of the current rate cycle reflects a combination of factors: Treasury yield compression on Iran ceasefire optimism, a general risk-on move in credit markets, and the ongoing uncertainty about the Federal Reserve's next move. The 10-year Treasury yield, which is the primary benchmark for 30-year mortgage rates, has pulled back from the 4.7 to 4.8 percent range that characterized late 2025 and early 2026.
But 6.33 percent is still 6.33 percent. The practical math for a first-time buyer is unforgiving. A $400,000 home purchase with 20 percent down generates a $320,000 mortgage. At 6.33 percent on a 30-year fixed loan, the monthly principal and interest payment is approximately $1,990. At the 3 percent rates of 2021, that same loan would have cost roughly $1,350 per month. The $640 monthly differential, annualized to $7,680, represents the affordability gap that the housing market is trying to work through. Some buyers are adjusting by purchasing smaller homes, accepting adjustable-rate loans, moving to lower-cost markets, or relying on family financial support for down payments. Most are simply waiting.
| Metric | March 2026 Reading | Month-over-Month | Year-over-Year |
|---|---|---|---|
| Pending home sales index | NAR index | +1.5% | -1.1% |
| Existing-home sales | Below prior pace | -3.6% | Mixed by region |
| 30-year fixed mortgage rate | 6.33% | Unchanged | Down ~50 bps |
| Months of supply (est.) | ~3.5-4.0 months | Slight improvement | Better than 2022 |
| Median home price (national) | Mid-$400,000s | Stable | Slight appreciation |
| Northeast/South pending sales | Positive | Gained | Outperforming |
| Midwest/West pending sales | Negative | Declined | Underperforming |
The ARM market is seeing renewed interest as a result of rate sensitivity. A 5/1 ARM at rates roughly 50 to 75 basis points below the 30-year fixed can meaningfully change the monthly payment calculus for a buyer who expects to sell or refinance within five years. The risk, of course, is that rates are still elevated at the adjustment date. Given that the market is not pricing significant rate relief until late 2026 at the earliest, the ARM-versus-fixed calculus is more complicated than it was in prior rate environments.
Spring Buying Season Assessment: Where the Market Actually Is
The spring buying season, traditionally the most active period of the housing year, is running in 2026 at a pace that real estate professionals describe as better than 2024 but below the more normalized activity of 2019. The combination of slightly improved inventory, rate relief from the 7 percent peak, and continued demographic demand from millennial buyers aging into homeownership is creating real transaction activity. But the structural distortion from the rate lock-in effect is suppressing supply in a way that prevents a genuine market clearing.
The seller side of the ledger is where the lock-in effect is most visible. A homeowner who refinanced at 2.75 percent in 2021 on a $400,000 balance is paying roughly $1,640 per month in principal and interest. If that same person sells, moves to a modestly larger home at $500,000, and finances $400,000 at 6.33 percent, the payment jumps to approximately $2,490 per month, a $850 monthly increase for essentially the same loan balance. That is a $10,200 annual cost increase that is effectively a penalty for moving. Many homeowners are rationally choosing not to pay it, which keeps supply constrained and prices stable even as affordability deteriorates for buyers.
For buyers who are actively in the market, the competitive dynamic is markedly less intense than 2021 or 2022. Bidding wars still occur in supply-constrained markets like coastal California, the Boston metro, and parts of the Pacific Northwest, but they are the exception rather than the rule. The median days-on-market figure has extended from the sub-10-day extremes of 2022 to roughly 30 to 40 days nationally, giving buyers more time to conduct due diligence and negotiate. That is a meaningful quality-of-life improvement for buyers who went through the exhausting experience of 2021-era housing competition, even if the rate environment remains punishing.
Real estate economists at Redfin and Zillow have noted that new construction is increasingly filling the gap left by existing-home inventory constraints. National homebuilders, particularly D.R. Horton, Lennar, and Pulte, have been aggressively using mortgage rate buy-downs as a sales tool, essentially subsidizing below-market rates for buyers of new construction by paying points upfront. That tactic effectively creates two mortgage markets: one for new construction buyers who can access subsidized rates closer to 5 to 5.5 percent, and one for existing-home buyers who face the unadulterated 6.33 percent market rate. This bifurcation is distorting the competitive landscape in markets with significant new construction supply.
What Moves the Housing Market From Here
The variables that would meaningfully shift the housing market equilibrium are well-defined. On the rate side, a sustained move below 6 percent on the 30-year fixed would begin to unlock some of the rate-locked inventory, particularly for homeowners whose original mortgages were in the 4 to 4.5 percent range, for whom the current rate penalty is less extreme. Getting to sub-6 percent requires the 10-year Treasury to fall toward 4.0 to 4.2 percent from current levels, which in turn requires either meaningful Fed rate cuts or a significant flight to safety event. Neither is the base case for mid-2026.
On the supply side, continued new construction activity and any acceleration in existing-home listing decisions would help. The demographic tailwind from millennials aging into peak homebuying years (ages 28 to 38) creates underlying demand that is not going away. The question is whether rate relief arrives before that demand cohort makes other arrangements: renting longer, moving to lower-cost markets, or accepting smaller homes than they originally targeted.
The April 21 data from NAR represents a market in equilibrium at a suboptimal level. Transactions are occurring, prices are not collapsing, and some buyers are finding ways to make the math work. But the volume of housing market activity remains well below what historical demographic and income trends would predict in a normally functioning market, and the March existing-home sales decline of 3.6 percent is a reminder that the thaw is gradual and fragile. For broader context on what rates have done to the spring selling season, see our earlier analysis of how mortgage rate levels have suppressed the spring 2026 selling window.
The forward signal to watch is the May existing-home sales report, which will capture the closings triggered by March's pending activity gain. If that print shows a rebound, it will confirm that the 1.5 percent pending gain in March translated into real transactions. If it does not, it will suggest that fallthrough rates are elevated and that the buyer pool is thinner than the pending data implies. That print lands in late May and will be the definitive verdict on whether spring 2026 was a genuine market inflection or a temporary blip within a prolonged freeze.
Frequently Asked Questions
What did the NAR pending home sales report show for March 2026?
NAR reported on April 21, 2026 that pending home sales rose 1.5 percent month-over-month in March but fell 1.1 percent year-over-year. Regional results were mixed: the Northeast and South gained while the Midwest and West declined. NAR Chief Economist Lawrence Yun attributed the monthly gain to continued pent-up demand despite elevated mortgage rates.
What happened to existing-home sales in March 2026?
Existing-home sales fell 3.6 percent in March 2026, with declines occurring in all four regions tracked by NAR. This creates an apparent contradiction with the pending sales gain, but the two data sets measure different things: pending measures signed contracts while existing-home sales measures completed closings, with a four-to-six-week lag between them.
What is the 30-year fixed mortgage rate in April 2026?
As of April 21, 2026, the national average 30-year fixed mortgage rate is 6.33 percent, according to the Wall Street Journal. This is at the lowest level in several weeks, driven in part by Treasury yield compression related to Iran ceasefire optimism, but it remains well above the sub-3 percent rates of 2020-2022.
What is the housing market lock-in effect?
The lock-in effect describes the reluctance of existing homeowners to sell homes financed at 2-3 percent mortgage rates and buy new homes at current rates above 6 percent. The monthly payment increase from that rate differential, often $600-$900 per month on a typical loan balance, is effectively a financial penalty for moving that suppresses existing-home inventory and reduces overall market transaction volume.
Are new-construction homes more affordable than existing homes in 2026?
In many markets, new construction has become relatively more accessible due to builder incentives. National homebuilders including D.R. Horton, Lennar, and Pulte are offering mortgage rate buy-downs that bring effective rates for new-home buyers closer to 5 to 5.5 percent, compared to the 6.33 percent market rate for existing-home purchases. This bifurcation is shifting some buyer demand toward new construction.
Sources
- NAR Pending Home Sales Report Shows 1.5% Increase in March - National Association of Realtors
- Existing-Home Sales Statistics - National Association of Realtors
- Mortgage Rates Today, April 21, 2026: 30-Year Rates Maintain Lowest Point in Weeks - Wall Street Journal
- NAR Pending Home Sales Report Shows 1.5% Increase in March - Globe Newswire


