

Seven weeks of war in the Middle East have pushed the global economy into its most serious stagflation risk since the oil shocks of the 1970s. That framing is no longer the provocative tail-risk take, it is increasingly the base case at the IMF, at major private-sector forecasters, and inside the central banks now trying to decide what to do about it.
This coming week's data will tell investors whether the risk is hardening into reality. Moneycontrol's weekend preview, drawing on Bloomberg analysis, flagged three indicators to watch: PMI readings across the major economies, consumer sentiment and retail sales, and incoming inflation prints. If all three move the same direction, the stagflation narrative becomes the one policymakers have to manage directly rather than argue around.
Why the 1970s comparison is actually earned this time
Stagflation, the combination of slowing growth and persistently high inflation, is uncommon precisely because the typical business cycle either features inflationary overheating (with growth) or demand destruction (with disinflation). Sustained episodes of both at once require a supply-side shock large enough to push prices up while also suppressing output. The 1973 oil embargo was the template. Most of what has happened since has either been isolated sectoral shocks or cyclical slowdowns.
The 2026 Iran war shock is different in shape. Roughly 12 million barrels per day of Middle East crude output and 3 million barrels per day of refined product capacity were taken offline at peak. Marine insurance rates on Strait of Hormuz transits surged by thousands of percentage points. Refinery damage in parts of Saudi Arabia and Iraq will take years to fully repair, according to reporting from CNN and Bloomberg. That is not a supply wrinkle. It is the largest single physical disruption to oil production since the Gulf War.
Brent crude is still trading around $90 per barrel, roughly $20 above pre-war levels, despite Friday's 8% decline on news of the Strait of Hormuz reopening. The futures curve does not price a return to pre-war levels until 2029. That embedded persistence is the stagflation input.
What the IMF is actually saying
IMF Managing Director Kristalina Georgieva told Bloomberg Television this week that the economic impact is already "baked in" even if hostilities stop immediately. Her argument is that the damage to physical infrastructure, the reorganization of global shipping routes, and the shift in inflation expectations cannot be reversed by a ceasefire. She added that policymakers now have to operate in a world of "high and permanent uncertainty."
The institutional framing matters because the IMF is not normally the voice of extreme downside scenarios in mid-cycle communications. When the Fund's managing director says damage is baked in, that is a shift in house view. The OECD has already erased its earlier global growth upgrade, and Goldman Sachs has moved recession odds to around 30% driven primarily by the oil shock's second-round effects.
Business surveys, inflation prints and central bank signals this week could reveal how deeply the Middle East conflict is hitting growth and prices.
Moneycontrol News, citing Bloomberg analysis
This week's data stress test
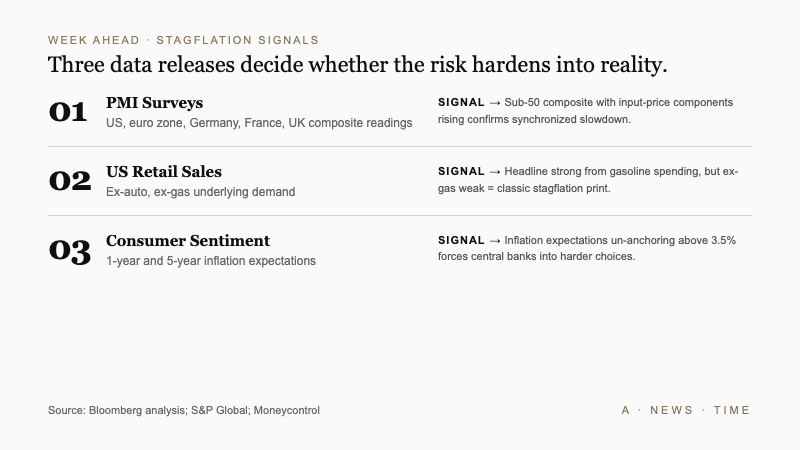
Three data releases will materially shift how this risk is priced. Each has a shape investors should know in advance.
| Indicator | What to watch | Stagflation signal |
|---|---|---|
| PMI surveys (US, euro zone, UK) | Manufacturing and services composites | Sub-50 composite with input prices rising |
| US retail sales | Ex-auto, ex-gas line | Weak underlying demand even as headline rises |
| Consumer sentiment | Inflation expectations 1yr and 5yr | Expectations un-anchoring above 3.5% |
| Euro zone April CPI | Core services | Core above 2.5% confirms sticky inflation |
The PMI readings are the cleanest early signal because they are forward-looking and survey-based. Early estimates flagged in Bloomberg's reporting pointed to broad deterioration across the euro zone, Germany, France, and the UK, with the US relatively steadier. If the actual releases confirm that pattern, the combination of slowing European activity and elevated input prices will reinforce the stagflation read directly.
US retail sales will look strong on the headline because of higher gasoline spending, which is misleading. The underlying story shows up in the ex-auto and ex-gas lines. Bloomberg's analysis noted that excluding fuel and vehicles, consumption is materially weaker than the top-line print will suggest. That is a classic stagflation transmission: nominal spending holds because prices are rising, but real spending is shrinking as households absorb the energy shock.
The central-bank dilemma
For policymakers, stagflation creates the worst response function of any macroeconomic condition. Cutting rates to support growth accelerates inflation. Raising rates to contain inflation deepens the slowdown. Neither path is clean.
European Central Bank officials are leaning on incoming survey data before their next decision. Chief economist Philip Lane has noted that businesses answering ECB surveys are facing the same uncertainty as policymakers. In the US, Federal Reserve rate-cut odds swung violently during the conflict, with markets briefly pricing more than 50% probability of a rate hike during the worst of the Hormuz blockade before collapsing back on Friday's reopening news.
The current market read, that oil declining past $80 gives the Fed room to cut in the second half, is contingent on two things both being true: the strait stays open, and services inflation finally gives way as energy prices ease. Neither is guaranteed. Services inflation has been the stickiest component in the US print for six consecutive months, and sits well above the Fed's 2% target on a year-over-year basis.
Across Asia, several emerging market central banks may be forced to hold or tighten policy despite weakening growth, because currency pass-through of higher energy prices is hitting headline CPI. That is the classic stagflation bind, and it is already visible in the policy path for India, Turkey, and Indonesia.
The specific channels to watch
Stagflation in 2026 is not a vague macro condition. It operates through specific transmission channels that will show up in particular indicators over the next six to eight weeks.
- Freight and shipping costs. Marine insurance premia on strait transits need to normalize before delivered crude prices fall back to pre-war shape. Each week those stay elevated adds to inventory carrying costs and final goods pricing.
- Food price volatility. Middle East conflict has historically pushed up wheat, rice, and edible oil prices via shipping and fuel cost channels. Emerging market households are more exposed to food inflation than developed market ones, which tilts the growth hit toward economies least able to absorb it.
- Manufacturing input costs. European industrial activity is particularly exposed to natural gas and petrochemical feedstock pricing. If Q2 industrial production in Germany contracts again, the euro zone growth story that was tentatively stabilizing collapses.
- Consumer credit. In economies where high oil prices squeeze household cash flow, credit card delinquencies and auto loan defaults rise on a lag. Watch for signs of that turn in the next two US monthly releases.
What to watch next
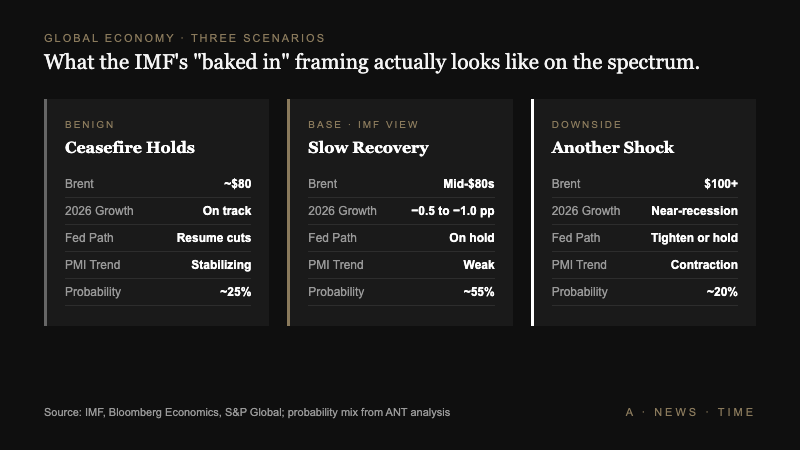
Three scenarios cover most of the plausible outcomes over the next quarter. The benign case: the strait reopening holds, oil drifts toward $80, European PMIs stabilize, and services inflation finally eases as energy disinflation filters through. Central banks resume cutting, and the stagflation risk fades into an asterisk on the 2026 growth story.
The central case, and the one most consistent with the IMF's "baked-in" framing: oil settles in the mid-$80s, growth stays weak through Q3, inflation remains above target in most developed economies, and central banks stay on hold rather than cut. Growth in 2026 comes in 0.5 to 1 percentage point below what forecasters were projecting in January.
The downside case: the strait reopening breaks, another supply shock hits, and the central banks that have been pricing in disinflation are forced to either tolerate a recession or tighten further into one. That is the scenario Georgieva is referring to when she talks about permanent uncertainty.
The week ahead decides which of those scenarios investors have to plan around. Chris Williamson, chief business economist at S&P Global, has already flagged the stagflation risk based on earlier global survey data. The next round of PMI prints tell us whether his early warning is turning into the operational reality.
Frequently Asked Questions
What is stagflation?
Stagflation is the combination of slowing economic growth and persistently high inflation. It is uncommon because most business cycles feature either overheating (with growth) or demand destruction (with disinflation). Sustained episodes usually require a supply-side shock, like the 1970s oil embargoes or the current Iran war energy disruption.
Why does the IMF say damage is already "baked in"?
Physical infrastructure destruction in Middle East oil facilities, reorganization of shipping routes around Strait of Hormuz risk, and shifts in inflation expectations cannot be reversed by a ceasefire alone. IMF Managing Director Kristalina Georgieva has said policymakers now have to operate in a world of "high and permanent uncertainty."
What PMI reading signals stagflation?
A composite PMI below 50, which indicates contraction, combined with rising input prices components, is the classic stagflation print. Early April data flagged in Bloomberg's reporting showed deterioration across euro zone, Germany, France, and UK readings, with the US holding steadier.
How much higher is oil than before the war?
Brent crude is trading near $90 per barrel, roughly $20 above pre-war levels, despite an 8% decline on April 17 when Iran announced the Strait of Hormuz reopening. The futures curve does not price a return to pre-war prices until 2029.
What happens if the strait closes again?
Another supply shock would push oil back above $100, reverse the Friday rally in equities, force central banks to tolerate higher inflation or tighten further, and push the IMF's near-recession scenario toward the base case. Marine insurance markets remain the cleanest leading indicator.
Sources
- Seven weeks of war, one big question: Is the global economy sliding into stagflation? - Moneycontrol / Bloomberg
- If the war's over, when does everything go back to normal? - CNN Business
- Market pros share 3 investments to load up on after the Strait of Hormuz reopening - Business Insider
- Here's what the stock market might have gotten wrong about the Iran war - The Washington Post


