
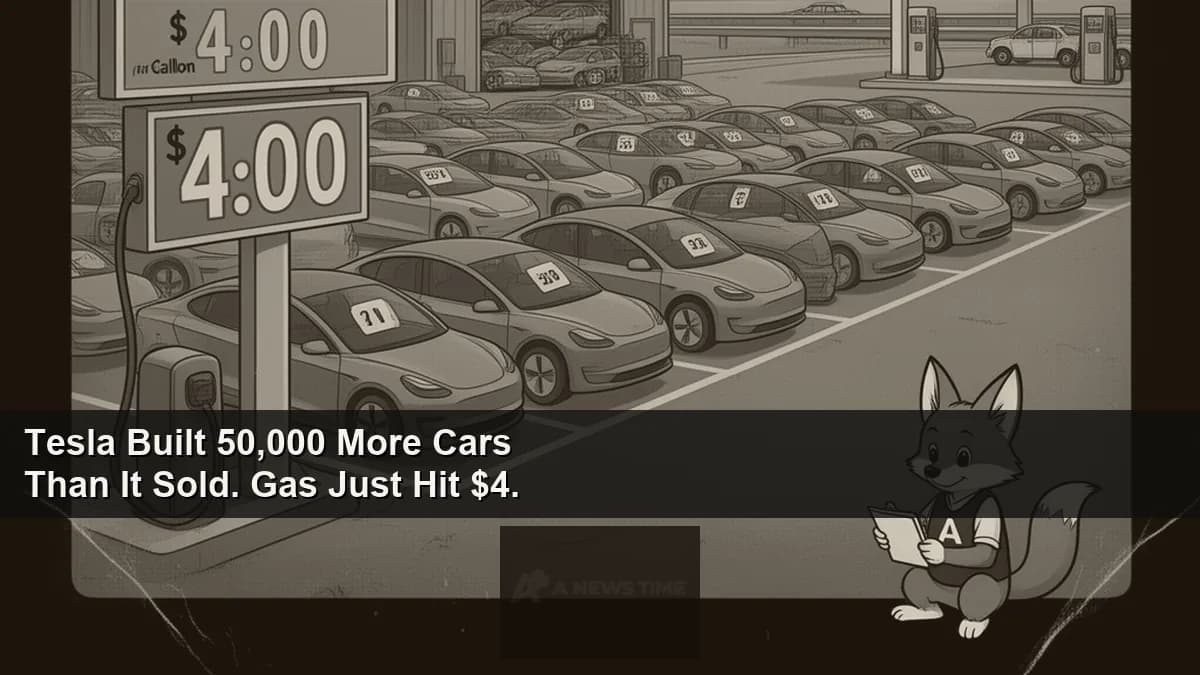
National average gasoline prices crossed $4.00 per gallon in the United States for the first time since 2023 during March 2026, and the timing landed precisely when analysts were watching EV quarterly sales numbers for evidence that fuel economics drive purchase decisions. Tesla delivered slightly more vehicles in the first quarter of 2026 than in the same period a year earlier, a marginal improvement that would ordinarily read as stabilization. The inventory figures told a different story. Tesla produced 50,363 more vehicles than it sold in Q1 2026, a gap that now represents the company's largest production-to-delivery overhang in recent history.
The contradiction between gas prices, which by economic theory should push consumers toward EVs, and actual EV purchase behavior, which in February 2026 fell 19.4% year-over-year in the U.S. market, is the central question in the EV industry entering the second half of the year. The answer requires separating Tesla-specific dynamics from market-wide trends, and separating U.S. dynamics from what is happening in Europe, where EV sales rose 22% over the same period.
The Inventory Overhang
Tesla's production-delivery gap is the number that carries the most weight in the Q1 2026 data. Automakers routinely produce slightly ahead of demand to maintain dealer inventory buffers, but those buffers are typically measured in days of supply, not tens of thousands of units produced in excess of sales. A 50,000-unit gap in a single quarter at Tesla's current production volumes represents a meaningful accumulation of unsold inventory that the company has to either sell at reduced prices, store, or eventually carry into future quarters.
The last time Tesla faced a comparable situation, it responded with a wave of price cuts. Those cuts moved vehicles but compressed margins significantly and triggered criticism from existing owners who had paid full price shortly before reductions. Tesla has not announced price cuts as of this reporting, but the options available when inventory builds at this pace are limited.
Analysts following the company note that some of the production excess reflects the ramp of new vehicle configurations and the Cybercab program, which added to factory output even as consumer demand for existing models remained soft. That explanation accounts for some of the gap. It does not account for all of it.
The Gas Price Paradox
The economic case for EVs at $4-per-gallon gas is straightforward on paper. Fuel costs are the most visible variable operating expense in vehicle ownership, and at $4 per gallon, the cost-per-mile gap between gasoline and electricity widens significantly in favor of EVs for drivers with regular charging access. James Bauer, an automotive analyst at Car and Driver, described the disconnect between theory and behavior in plain terms.
"Gas at $4 should be an EV tailwind. It's not working that way right now in the U.S. The problem isn't the economics of ownership. It's the upfront price, the charging infrastructure anxiety, and the removal of the federal tax credit. Those three things are counteracting the fuel cost math."
James Bauer, Automotive Analyst, Car and Driver
The federal EV tax credit elimination is the variable that changed most significantly since the previous period of high gas prices. The $7,500 credit under the IRA functionally reduced the effective purchase price of eligible EVs at the point of sale. With that credit gone, a consumer comparing an EV to a gas vehicle is comparing full sticker prices rather than net-of-subsidy prices. At $4 gas, the operating cost argument eventually catches up over the vehicle lifetime. In a 36-month financing window, it may not.
U.S. vs. Europe: Two Different Markets
The 19.4% decline in U.S. EV sales in February 2026 and the 22% increase in European sales over the same period illustrate how dramatically policy environment shapes EV adoption independent of fuel prices. European markets maintained purchase incentives in most major markets, invested more aggressively in public charging infrastructure, and in several countries implemented stricter emissions standards that effectively penalize internal combustion vehicle ownership through higher registration costs and urban access restrictions.
| Market | EV Sales Change (Feb 2026 YoY) | Federal Tax Credit Status | Avg. Gas Price (March 2026) |
|---|---|---|---|
| United States | -19.4% | Eliminated | ~$4.05/gallon |
| Europe (aggregate) | +22% | Maintained in most markets | ~$7.20/gallon equivalent |
The comparison also reflects different vehicle price structures. The average EV transaction price in the U.S. market sits significantly higher than the average gas vehicle transaction price, a gap that has closed somewhat but not enough to remove the upfront affordability barrier for median-income buyers. In European markets, a wider range of affordable EV models is available from manufacturers including Renault, Volkswagen, and Stellantis brands that have not prioritized the U.S. market at comparable price points.
Tesla's Model-Specific Position
Tesla's situation within the broader U.S. EV market is complicated by factors specific to the brand beyond the general policy and pricing environment. The company's political associations in 2025 and 2026, particularly the public visibility of Elon Musk's government advisory role, have generated documented consumer backlash in segments that were previously favorable to the brand. Brand perception surveys in early 2026 showed Tesla's net favorability declining among college-educated buyers aged 25-45, a demographic that had historically been among the company's strongest customer bases.
At the same time, Tesla's charging infrastructure, the Supercharger network, remains one of the most functional advantages any EV manufacturer can offer. Several competing automakers have now adopted the NACS connector standard and are offering their vehicles with Supercharger network access, which reduces one of Tesla's most significant moat advantages. The charging argument for choosing Tesla over a competing EV is weaker than it was two years ago.
- Tesla Q1 2026 deliveries: slightly above Q1 2025 levels
- Tesla Q1 2026 production: 50,363 units above deliveries
- U.S. EV market: -19.4% in February 2026 year-over-year
- European EV market: +22% same period
- National average gas price (March 2026): above $4.00/gallon
- Federal EV tax credit: eliminated
What the Rest of 2026 Looks Like
The second half of 2026 will be the more informative data set for understanding whether the gas price signal eventually overcomes the structural headwinds in U.S. EV demand. Sustained $4-plus gas over a full year changes how consumers evaluate vehicle purchases at the renewal or replacement stage in a way that a few weeks of elevated prices does not. Most vehicle purchase decisions are not impulse decisions. The three-month trailing average of fuel cost tends to carry more weight than the current price on the day someone walks into a showroom.
For Tesla specifically, the inventory situation has to resolve one way or another by midyear. The company can run promotions, adjust pricing, or slow production to bring the gap down. Each option has different implications for margins and for how the market reads the company's demand environment. The Q2 2026 delivery report, due in early July, will be the next concrete data point on which direction Tesla is navigating.
For the broader EV market, the signal that matters most is whether Congress revisits the tax credit question. At $4 gas, the political calculus for reviving some form of EV purchase incentive is different than it was at $3.50 gas. Whether that calculation produces legislative action before the market fully absorbs the policy change is the variable most likely to reshape the second half of 2026's EV sales picture.


